Raquel Formanek, Product Specialist, Quantitative Analytics, and Graham Whitelaw, CFA, Product Specialist, Quantitative Analytics, contributed to this report.
How well do you know your analysts, or more specifically, their stock recommendations? It’s a simple question on the surface but one that a lot of asset managers struggle to quantify when constructing a portfolio.
Aside from attributing historical portfolio return across analysts to see who outperformed and underperformed, managers seek to understand:
- How accurate are analyst forecasts?
- Who’s beating the street and who’s mirroring the consensus?
- How long do our analysts’ recommendations take to realize alpha?
- What are our analysts’ hit rates and batting averages?
Creating a Test Case
To accurately measure performance of a test group, we used FactSet Research Management Solutions (RMS) in conjunction with Alpha Testing, our backtesting tool, to bind analyst forecasts and other qualitative data to the securities within our coverage list. We used a time frame of 10 years focusing on the efficacy of the analysts’ forecasted expected return and their Buy/Hold/Sell ratings.
Related: Moving from Research to Portfolio: Beyond Construction
A core measurement we will be evaluating is the Information Coefficient (IC). The IC is one of a few ways to measure the accuracy of an analyst’s forecast, as it correlates the analyst’s ranked expected return and the ranked realized return that was experienced over a forward horizon (in our case, one year). A correlation of 1 would indicate a perfect prediction of security returns. As commonly cited elsewhere, we consider an IC of approximately 0.05 to be indicative of an above average signal of an analyst’s forecasting ability.
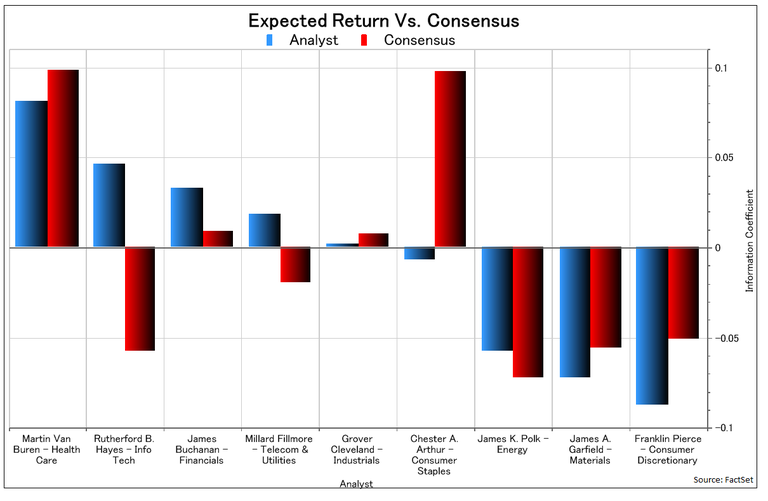
Measuring the Skill of Our Analysts
In the chart above, the blue bar represents each analyst’s skill as measured by his or her IC. The red bar indicates the skill of the Street, as measured by the consensus estimate. Of our analysts, Martin Van Buren has the strongest predictive power with an IC of 0.08, whereas Franklin Pierce’s forecasts have very little correlation with realized returns with an IC of -0.08.
Related Capitalizing on Earning Surprises with Intraday Updates
Furthermore, we can use the IC as a barometer of how powerful the analyst’s forecast is when compared to that of the Street. While Martin shows promise from a forecasting perspective, as demonstrated by the highest IC on a standalone basis, he actually lagged the street. Alternatively, Rutherford B. Hayes has a strong IC of 0.05 and is clearly different than the street’s IC of -0.06; this indicates he has strong forecasting abilities and has differentiated his stock picks from the consensus, adding unique alpha. By this measure, Rutherford’s skill in picking Information Technology stocks cannot be ignored.
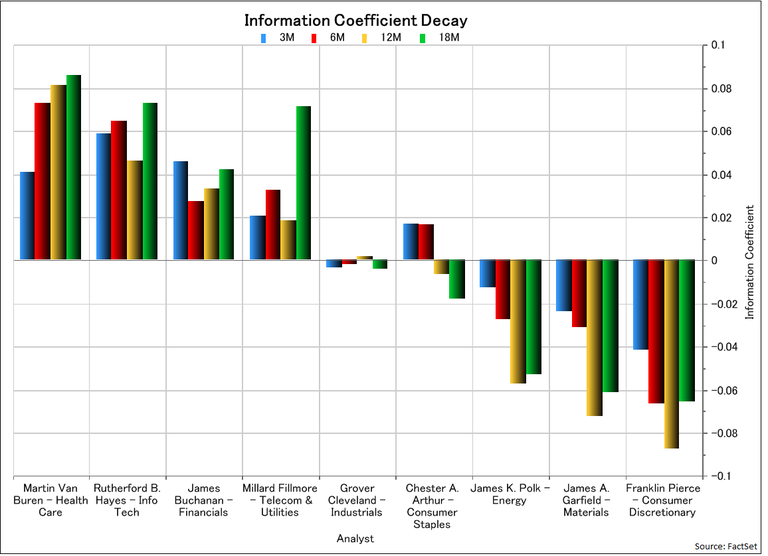
Our analysts submit forecasts on a one-year horizon but not all recommendations realize alpha at the same rate. Therefore, it is helpful to analyze the decay or enhancement over different horizons. In the chart below, we evaluate ICs over different periods to determine whose picks appreciate or depreciate over the subsequent periods. Specifically, each bar in the chart represents a return horizon: three months, six months, 12 months, and 18 months, respectively. Martin shows that the longer his picks are held, the more accurate his forecast becomes. Notably, Millard Fillmore shows the most predictive power 18 months out with an IC of 0.07. By trading Millard’s picks closer to recommendation date, we have a lower probability of realizing the price appreciation that he has forecasted. Knowing that, we may want to hold Millard’s picks closer to 18 months.
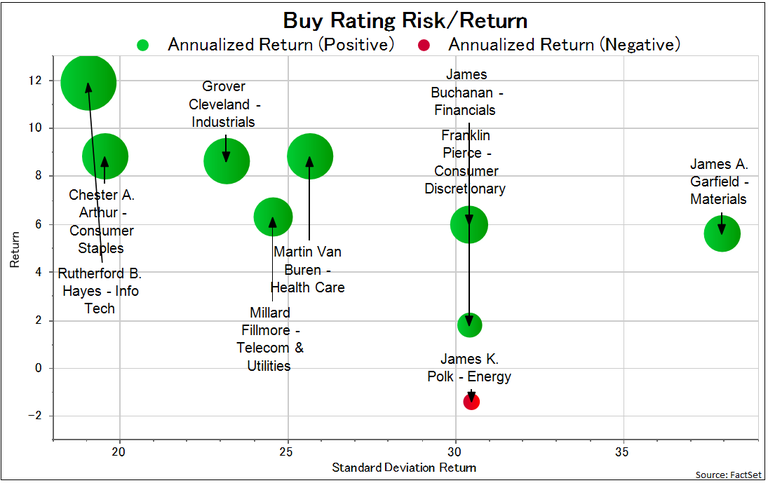
Risk vs Return
Thus far, we have gained significant insight into our analyst’s predictive ability over the past 10 years but are still left with questions such as how much risk was needed to achieve the return earned on a stock recommendation? In the scatter plot below, we show the risk and return figures for our analysts’ “Buy” ratings. The Y-axis represents the annualized return, and the X-axis represents annualized standard deviation. Chester A. Arthur has a very compelling risk/return tradeoff for his “Buy” rated securities despite his low aggregate IC.
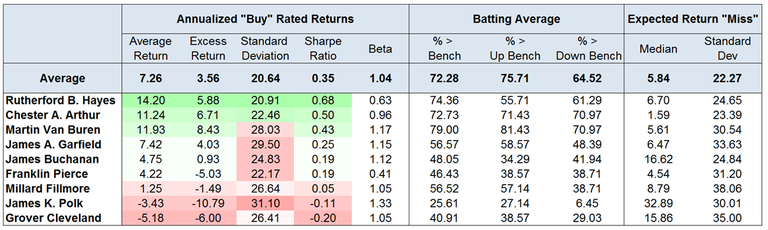
Examining the subset of “Buy” rated stocks within our coverage universe, we are able to compare the annualized performance across our analysts. Within the table below, we see further evidence that Mr. Hayes has outperformed his peers over the past 10 years. On average, his selection of low Beta stocks within Information Technology (0.63 on average) has contributed to a high “batting average” (the % of periods where he beats the benchmark). Although he beats less frequently when the market is up, the low beta selection has cushioned his relative performance in market downturns, as shown by 61% > Bench when the benchmark is exhibiting negative returns.
Further, while our analysis thus far has orbited around the efficacy of analysts’ Buy/Sell rating and Expected Return, we also wanted to evaluate the magnitude of the Expected Return Miss; how far from the realized return was the analyst’s Expected Return? A significant underestimation of the Expected Return (even if directionally correct), leads to a missed opportunity; if the analyst had correctly predicted the price appreciation, the portfolio manager could have had more conviction when overweighting the stock in order to capture alpha.
Translating Past Performance into Future Returns
Now that we have an idea for which analysts are the most effective predictors of future returns, we can use this information in a portfolio construction process. By integrating data from our RMS into an optimizer we can allocate to our analysts more intelligently, maximize our exposure to our highest conviction stocks, and mitigate undesired exposures.
This exercise illustrates how a deeper understanding of the behaviors, track records, and performances of analysts can help a firm make more consistent, and potentially more lucrative, investment decisions in the future.


Insight/Author%20Bios/BadgeNLWF.svg)
