Dividends per share for the S&P 500 amounted to $44.80 for the trailing 12 months ending in Q3, which represented a 4.2% increase from the year-ago period. This amount marked the largest dividend per share total for the index on record. The TTM ending in Q3 was the fourth consecutive period in which DPS growth slowed and the fourth consecutive period that DPS grew at only a single-digit clip. Looking at aggregate dividends per share for S&P 500 companies in the third quarter versus the second quarter, the index posted just a 1.3% rate of growth. 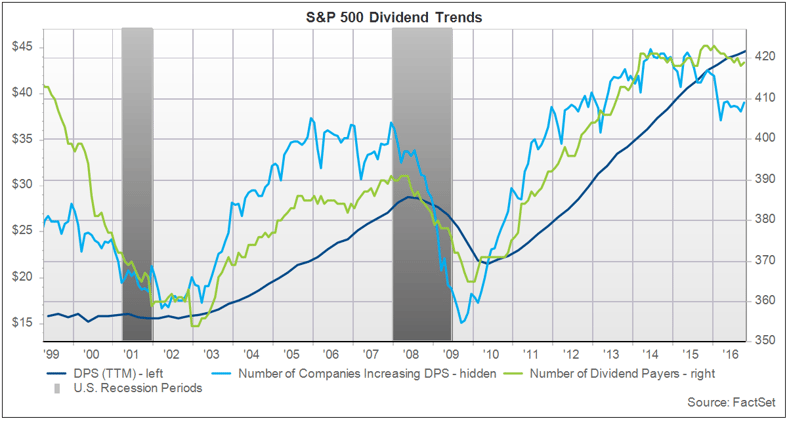
Dividend Payout Ratio Increases to 40.2%, Expected to Fall in the Next 12 Months
The S&P 500 TTM dividend payout ratio was 40.2% at the end of Q3, which was an 8.4% increase year-over-year and a 1.7% increase from a quarter ago. The ratio represented a 26.9% premium to the median payout ratio going back five years. It also marked the index’s largest dividend payout ratio since Q3 2009.
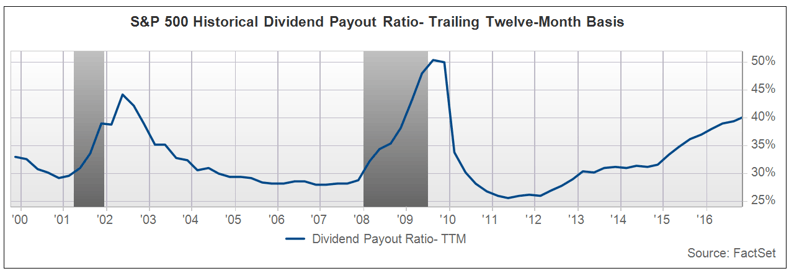
Keep in mind that earnings growth for the S&P 500 index returned in Q3 for the first time since Q1 2015. Additionally, earnings growth is expected to outpace dividend per share growth over the next 12 months, which is why analysts are predicting that the index’s payout ratio will fall to 36.9%.
Payout Ratios Exceeding 100% for 44 Companies
In the trailing 12 months ending in Q3, 44 companies in the S&P 500 had payout ratios exceeding 100%, which was the second highest count in the past 10 years (after Q1 2016). This number excludes firms with negative earnings per share and firms that do not pay out a dividend. Of the 44 companies, 20 companies came from the newly formed Real Estate sector. The next highest representation was from the Consumer Staples sector, in which five companies had payout ratios above 100%.
Highest Yielding Decile of Dividend Payers was a Bottom Performer YTD
FactSet looked at dividend payers in the S&P 500 index and organized the companies into deciles by indicated annual dividend yield.
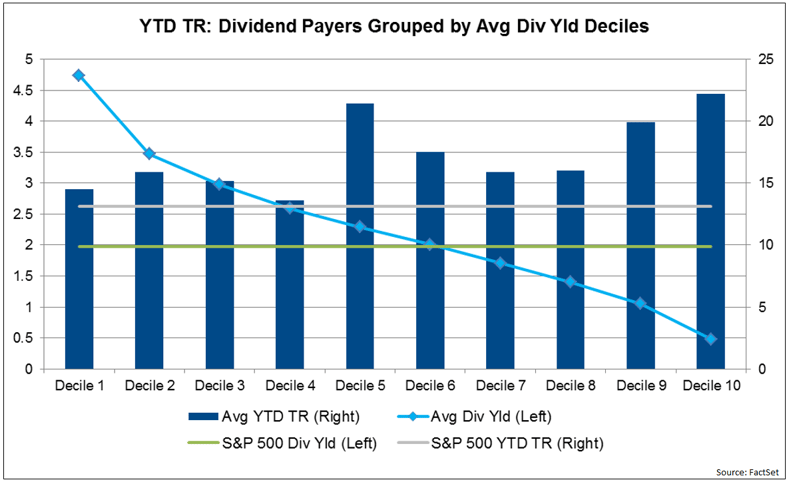
Decile 1, (companies with the highest dividend yields) which had an average dividend yield of 4.7%, posted the third highest average total return of the deciles in the first half of the year (12.5%) and the lowest average total return of the deciles in the second half of the year (3.1%). On a YTD basis, Decile 1 had a total return of 14.5%, which exceeded the return of the S&P 500 (13.1%), but was still the second worst-performing decile. A more appealing alternative for an investor looking for yield above the S&P 500 aggregate dividend yield (1.98%) and a YTD return above the benchmark, (13.1%) would be companies in Deciles 2, 3, or 5. Decile 5, which had an average dividend yield of 2.3%, was the top performing group on average this year, posting a total return of 21.4%.
Read more of this quarter's trends in the full Dividend Quarterly report.


