Most ETFs track indexes. This means that ETF investors can understand exactly how much it costs, all-in, to hold an ETF. ETF investors expect to get the index returns, minus fund expenses, with no surprises.
But, it turns out there’s a lot more to this story than you might expect. To tease out how well run – or how complex – an index-tracking ETF is, we generally turn to tracking difference; the performance gap between the ETF’s Net Asset Value (NAV) returns and the returns of its underlying index. Alas, this measurement can be not just useful, but maddening.
In a perfect world, tracking difference tells the investor the exact difference between expectations (index performance) and reality (NAV total returns), excluding any trading costs. All else equal, we would expect tracking difference to equal the net expense ratio, plus portfolio management slippage, minus foreign dividend tax recapture, minus securities lending revenue. The problem is that all else is not equal. And it gets worse when NAVs are calculated asynchronously vs. the underlying index.
First off, the actual ex-post expense ratio might not equal the ex-ante ratio stated in the prospectus.
Second, portfolio management slippage is real, but generally not made available to the public.
Third, foreign dividend tax re-capture might not square with the underlying index’s applied withholding rate.
To cap it all off, some issuers calculate NAVs for non-U.S. equity funds using exchange rates taken at 4:00 p.m. ET, rather than the standard WM Reuters 4:00 p.m. GMT (10:00 a.m. ET).
Put that all together, and you have a bit of an interpretation problem.
Where Tracking Difference Works
Nevertheless, tracking difference remains a quite useful tool. Here’s a few ways you can look at it:
First, a simple case, where tracking difference tells you all you need to know about long-term holding costs; the three S&P 500 ETFs. Because the portfolios are limited to U.S.-listed stocks, you don’t have to worry about foreign tax withholding or fair valuation. Also, securities lending will not be a huge factor in the U.S. large/mid-cap space. So the differences in holding costs will come down to expenses and portfolio management.

The first thing you see is that the median tracking difference is very close to the expense ratio (± .01%), which is exactly what you would expect.
You might not have expected the differences in the range, which is the tracking difference span from the maximum upside to the maximum downside. The tracking range is a great measure of variability.
SPY’s tracking range is four times the width of IVV’s or VOO’s. That’s huge! But there are probably reasons. SPY is structured as a Unit Investment Trust base, which means it can’t reinvest any cash that comes in from dividends. It’s required by law to hang on to the cash until they pay it to investors. From a pure tracking perspective, SPY is clearly the worst choice of the three. VOO seems to edge out IVV, despite its slightly higher expense ratio and BlackRock’s aggressive securities lending policies. Why? The honest answer is “there’s no way to know for sure,” which is deeply unsatisfying. The good news is that we’re talking about minuscule differences – too tiny to make or break an investment decision.
Tracking difference is useful in international funds, too, but you need to be a bit savvy about index construction to use it well. The next example of emerging markets vanilla ETF tracking difference introduces a wrinkle; variability in the indexers’ practices around foreign dividends. 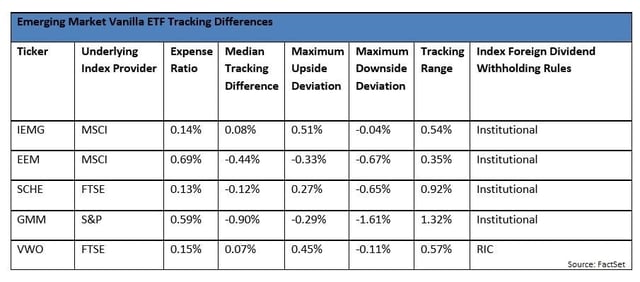
A Few Observations
IEMG’s and EEM’s apparent outperformance vs. their expense ratio is likely attributable to inadvertent sandbagging; MSCI’s rules for accounting for net withholding are simply far more conservative than the actual experience of a U.S. fund running an ETF, and so the funds “pick up” that difference as positive relative performance.
SCHE has that same sandbagging relative to VWO, even though it seems like they track the same FTSE index series. The reality is they track slightly different index variants, with Vanguard’s Registered Investment Company version a bit more realistic for a mutual fund in terms of withholdings than Schwab’s Institutional one.
Even so, SCHE’s tracking difference is still not great, underperforming by a median of 19 bps. That’s significant. Its overall tracking range of 0.92% is surprisingly large, in context. Why? Again – impossible to know precisely, but I’d suspect differences in securities lending revenues and optimization, as SCHE holds only 850 of the 982 stocks in the FTSE emerging index.
Speaking of optimization, GMM has a highly optimized portfolio, and it shows. Its range is very large in comparison to the other funds in the space, and its median is depressed relative to its expense ratio. Optimization almost always introduces wider tracking differences, which is fine if they’re consistently working in your favor. Unfortunately, here it doesn’t look like they are.
If holding costs are your main concern, eliminating SCHE and GMM for poor tracking makes sense. Eliminating EMM on cost alone makes sense too, narrowing the choice of a cheap-to-hold vanilla emerging markets ETF down to two funds: IEMG and VWO. Given that VWO’s positive median tracking difference is far more believable than IEMG’s, and that their overall range is quite similar, I’d say that VWO is the clear winner from a holding cost perspective. Of course, there’s a lot more to consider than just Tracking Difference – the two funds have radically different investments, with VWO including Chinese A-shares but ignoring South Korea entirely but, IEMG investing 15% of its portfolio in the country. These exposure differences will likely dwarf any tracking difference comparison. Where Tracking Difference Fails
Sometimes, tracking difference explains more about the index business than portfolio management. Take a look at the U.S. Aerospace and Defense segment, and you’ll see that one fund, PowerShares Aerospace & Defense, has an unexpectedly positive tracking difference.

These three funds have similar holdings, with heavy stakes in firms like Boeing and Lockheed Martin. Securities lending opportunities are most likely quite similar and limited for all three providers, but PowerShares has not been actively lending stocks in PPA’s portfolio. By rights, PPA’s 12-month tracking difference should be pretty close to its 64 basis point expense ratio. But PPA’s tracking difference appears to be positive, by 0.96%.
In fact, the positive tracking difference is an illusion. The index that FactSet uses to calculate PPA’s tracking difference, the SPADE Defense Index, does not re-invest any dividend payments. We have no idea why, as virtually every index in the world is calculated as a total return index by default. In this case, however, the index provider simply doesn’t, which introduces a huge sand-bagging effect. To get a clear picture, we need to back out the dividend yield from the index return.
PPA’s portfolio had a trailing 12-month dividend yield of 1.61% as of October 1. Therefore, PPA’s corrected tracking difference should be 0.96% - 1.61% = -0.65%. That’s precisely what we should see from a fund with a 0.64% expense ratio.
What a boring outcome. In U.S. Aerospace & Defense, funds’ expense ratios tell you pretty much all you need to know about their long-term holding costs. The tracking difference statistics simply highlight the importance of using total return indexes.
It gets worse. Sometimes fund net asset values simply don’t match the index values, because of differences in their accounting rules.
This is on display dramatically in the Japan Total Market segment. The real action is in the range – the variability of tracking difference.
When we looked at the S&P 500 funds, the tracking range was a make-it-or-break-it field. Investors like predictability. Tight tracking ranges suggest that portfolio management is consistent over long periods of time. Wide ranges mean that investors can’t know what’s coming, and that makes a body nervous. But in this case, investors can calm down, because the tracking range has been artificially inflated. Blame it on the fund accountants, or on clever fund construction.

Let’s look at FJP first. Overall, FJP tracks its index pretty well, trailing it by less than its expense ratio would predict. But FJP’s tracking range – varying from 2.42% on the upside to -3.78% on the downside, looks downright scary. But there’s a story here.
First Trust, like many ETF issuers that offer both exchange-traded funds and mutual funds, has to be mindful of market timing in its mutual funds. Since the days of the mutual fund timing scandal, mutual fund accountants have been obligated to value all foreign currency positions as of 4:00 p.m. ET, when the U.S. markets close. Issuers want to use uniform calculation methods for mutual funds and ETFs, so the ETF NAVs also use a 4:00 p.m. ET currency strike.
Index providers don’t have to worry about market timing, because indexes aren’t portfolios. Index calculation agents don’t have to worry about fund accounting rules or premiums and discounts. So they follow the index industry standard, and quote their currency positions at 4:00 p.m. London time (or 10 a.m. ET). On days when the Japanese Yen is volatile, this six-hour difference can push NAVs off of index levels by several percentage points. FJP’s tracking range isn’t bad. It’s just drawn that way.
You’d think that the same would hold true for HEWJ. After all, BlackRock manages a huge suite of mutual funds. But you’d be wrong.
BlackRock didn’t always own iShares. It bought the business from Barclays, who had been managing it for Morgan Stanley, which designed ETFs to track MSCI’s indexes. iShares started out with every incentive to treat its ETFs like indexes. That means using 4:00 p.m. London currency strike times in their NAV calculations. This practice continues, even under BlackRock. HEWJ’s NAV is not fair-valued.
Instead, HEWJ’s tracking range is a victim of Blackrock’s cleverness. Let me explain.
BlackRock’s currency-hedged suite takes advantage of the enormous liquidity of iShares biggest international funds, to build a highly liquid, easily tradable currency-hedged version. They simply take an unhedged ETF like iShares MSCI Japan (EWJ), and use it to provide exposure to the MSCI Japan index. They add in a currency hedge, and voila! A two-position portfolio that offers hedged exposure to the Japanese large and mid-cap equity markets.
We know that EWJ tracks its index well, with a median tracking difference of -0.28% and a range of only 0.40%, which is not bad for a basket of securities that don’t even trade during US market hours. But here’s the thing: EWJ trades right up to 4:00 PM ET. EWJ’s price will reflect up-to-the-minute information, including both movements in the Japanese Yen, but also investor sentiment about the portfolio securities. EWJ’s market price is nothing like its NAV. That’s why EWJ’s premium/discount chart looks like this:
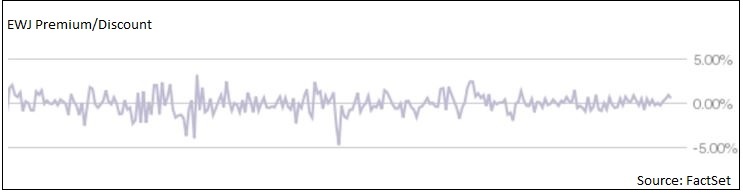
HEWJ’s NAV is calculated using the closing price of EWJ, not its NAV. That opens the door for EWJ’s “premium” or “discount” to flow through to HEWJ’s NAV. In general, EWJ’s premiums/discounts are not real, but simply a reflection of the staleness of EWJ’s NAV. HEWJ passes along the discrepancy.
In HEWJ’s case, the best way to assess tracking range is to proxy it via EWJ. For FJP, investors are simply out of luck, until the day that First Trust decides to provide non-fair valued NAVs.
In the end, tracking difference and tracking range are only as good as their input data. For ETFs covering U.S.-listed stocks, tracking indexes that reinvest the dividends, in markets where securities lending revenue is stable, tracking statistics allow investors to predict their future holding costs pretty darn well. But as soon as something gets complicated, whether by international exposure that has to deal with dividend tax withholding and post-mutual-fund-timing-scandal regulations that drive a wedge between NAV and index returns, or by sloppy index calculation, tracking difference needs to be unpacked before it can become useful. Often investors need additional information about NAV valuation practices, index return types, and index dividend withholding rates, in order to make real comparisons between funds.
The interpretation of tracking difference is not always cut and dried, but there’s usually a story there.


Insight/Author%20Bios/Elisabeth.jpeg)
