The Basics
Using pure machine learning, Alexandria has constructed an AI analyst that thinks like a professional but performs like a machine. Its high-performance engine scans tens of thousands of daily financial news items almost instantly and accurately identifies the hidden sentiment, critical facts, and key relationships buried within them. Alexandria Text Analytics - Economic is generated from highly respected sources covering global macro economies and includes Alexandria’s event-specific topic models, which gives firms the ability to plug news into investment strategies and gain a more granular understanding of sentiment on subjects ranging from debt to interest rates, monetary policy, and more.
The Applications
Use Case
|
Description
|
|
Portfolio Management
|
Develop economic regime indicators
|
|
Asset Allocation
|
Determine overweight/underweight regions or countries based on relative aggregated sentiment
|
|
Quantitative Research
|
Discover alpha factor for quantitative investment models
|
The Coverage
The Alexandria Text Analytics - Economic Data Feed covers 22 macro-economic news topics across 75 economies spread across the world with 15 plus years of history. The economy level data provided by Alexandria has been standardized and reconciled to FactSet country identifiers and the Story IDs are aligned between the Alexandria Economic and Company feeds, allowing the same story to be viewed distinctly from both a company and economic perspective.
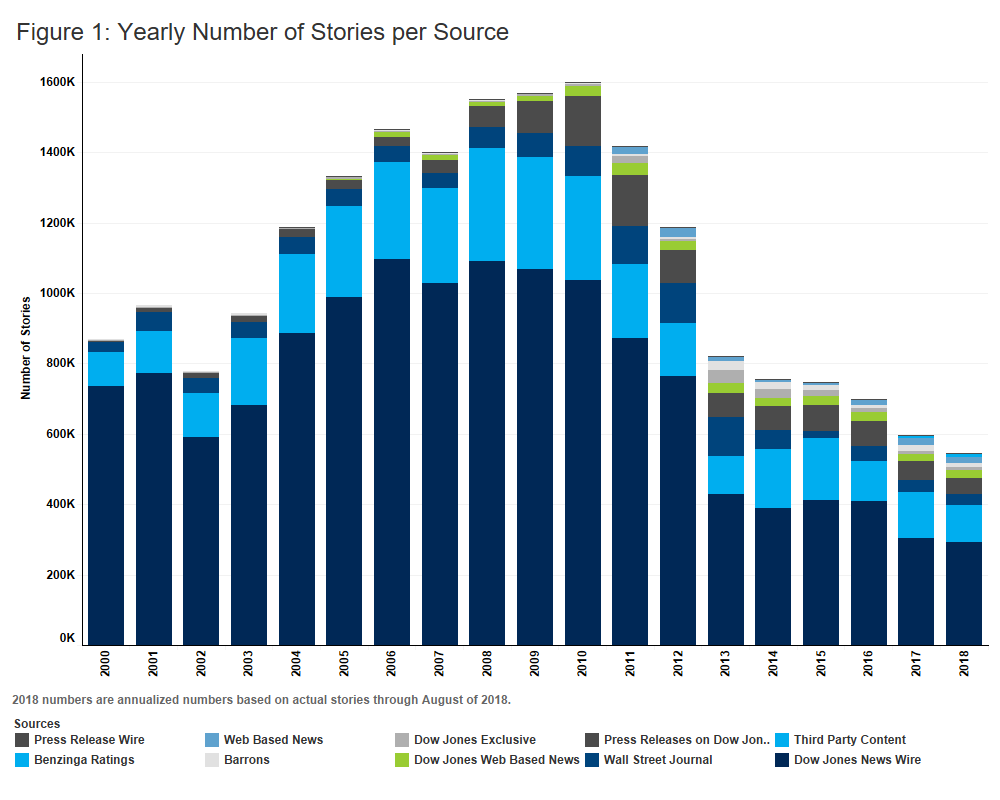
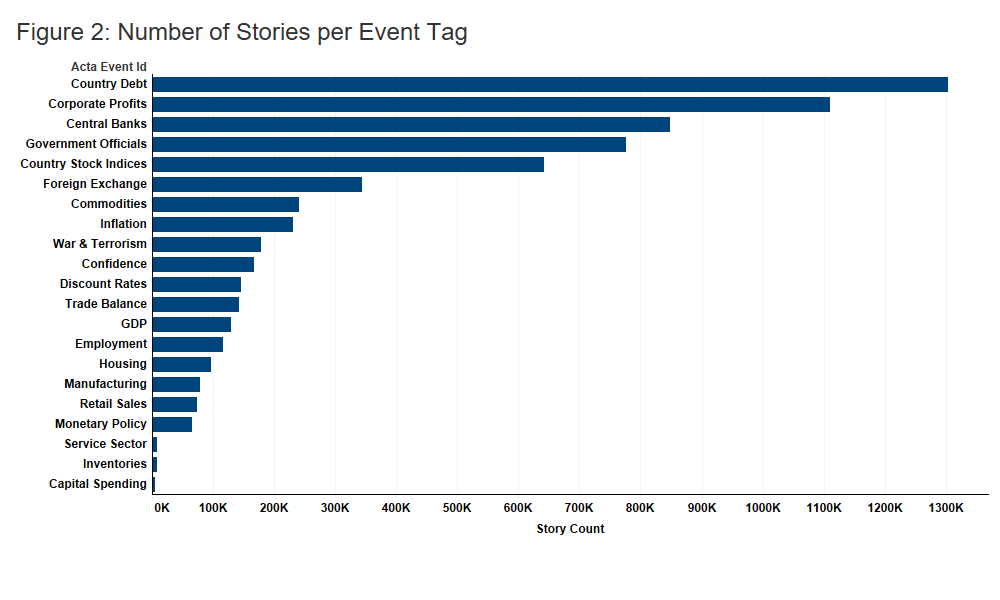
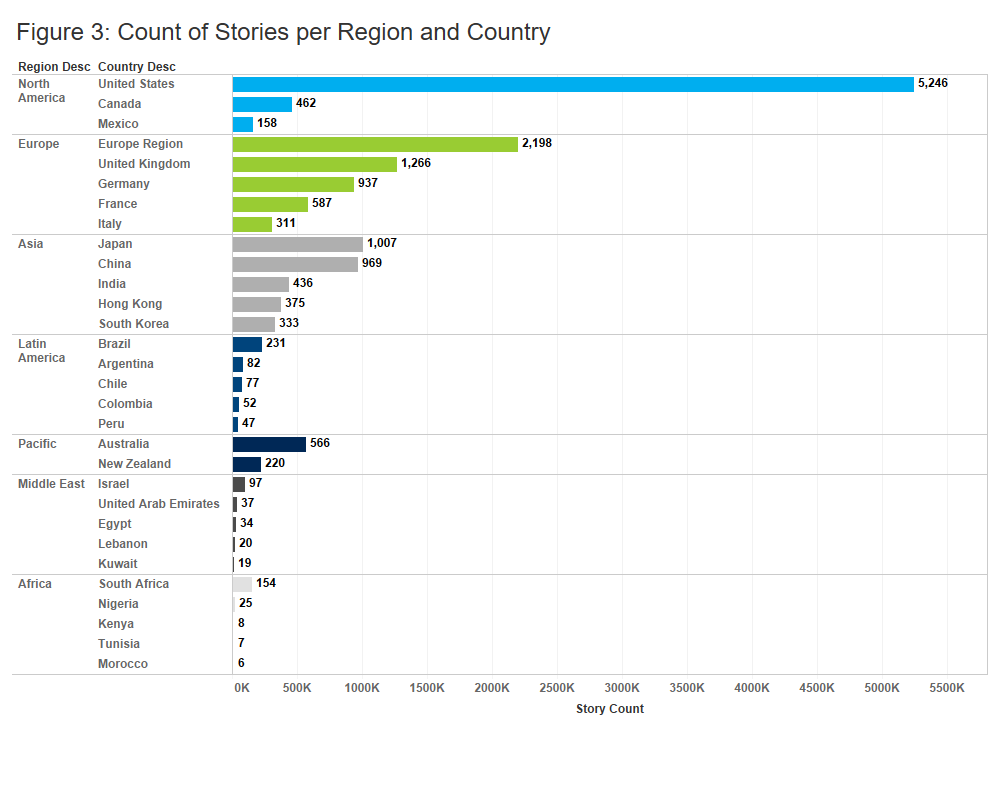
Figure 1 below represents the yearly number of articles published per source. Alexandria coverage mirrors the output from various Dow Jones sources, the decline in stories from 2010 to present reflects a concerted effort on the part of Dow Jones to refine its reporting with an increased emphasis on quality over quantity. Figure 2 shows the number of stories per event tag and Figure 3 highlights the global coverage of the data, showing the number of stories for the top countries in each region.
The Differentiators
Beyond coverage and history, key factors to consider when evaluating a news sentiment provider are the content analysis method, sources, classification/event tagging, and entity identification.
Alexandria utilizes artificial intelligence algorithms to analyze sentiment, identify entities, and classify stories by event types. The algorithms are trained using historical new stories reviewed and annotated by domain experts including buy-side research analysts, Strategists, and CFA charter holders. The Alexandria history dates to 2000 and has been out of sample since 2005.
Research shows that an artificial intelligence or machine-learning based approach increases the accuracy of event classification and results in a higher rate of non-neutral stories compared to a dictionary or word-list approach. From our evaluation of its data, Alexandria is able to produce non-neutral sentiment scores for 40% of the stories in the dataset (on par with scores produced by humans) vs. a dictionary or rule-based sentiment calculation average of ~20%. This grows to 46.3% when filtering to only stories with at least one event tag and excluding stories related to Calendar which have no sentiment. Alexandria’s research shows that its machine-learning approach matches human-generated classifications over 90% of the time.
Alexandria Economic taxonomy includes 22 different topics including GDP, Discount Rates, Monetary Policy, Confidence, Employment, and Corporate Profits. Additionally, the data set includes a flag for stories that are headlines only, a novelty count per story, as well as metrics around confidence and the probability of a story being positive or negative. All of these can be used to create more nuanced signals from the Alexandria data such as net sentiment factors based on articles with a high confidence score that are from an institutional news wire source.
Example Use Case
One interesting application of Alexandria Text Analytics - Economic is creating an economy-focused net sentiment factor as a quantitative measure of the traditional Fear/Greed gauge. For this analysis, Alexandria sentiment data was extracted for the United States from January 1, 2000 to August 31, 2018.
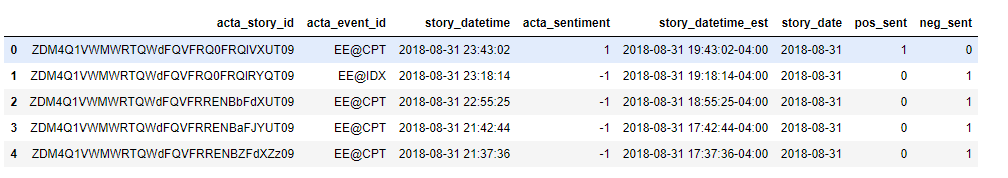
Alexandria’s algorithm applies a trinary sentiment score to every article, It is possible, however, that an article may have a potentially meaningful probability of the opposite or neutral sentiment. For example, the stories shown below have negative sentiment, but all three have a probability of being positive that is greater than 0.3

These probability scores are used to determine the confidence score for each article’s overall sentiment. For this analysis, only stories with a non-neutral sentiment and a confidence score greater than .6 are included. The confidence filter was applied to ensure the net sentiment factor is calculated using articles where a single sentiment dominates the story. Additionally, any articles that don’t have any event tags applied have also been removed.
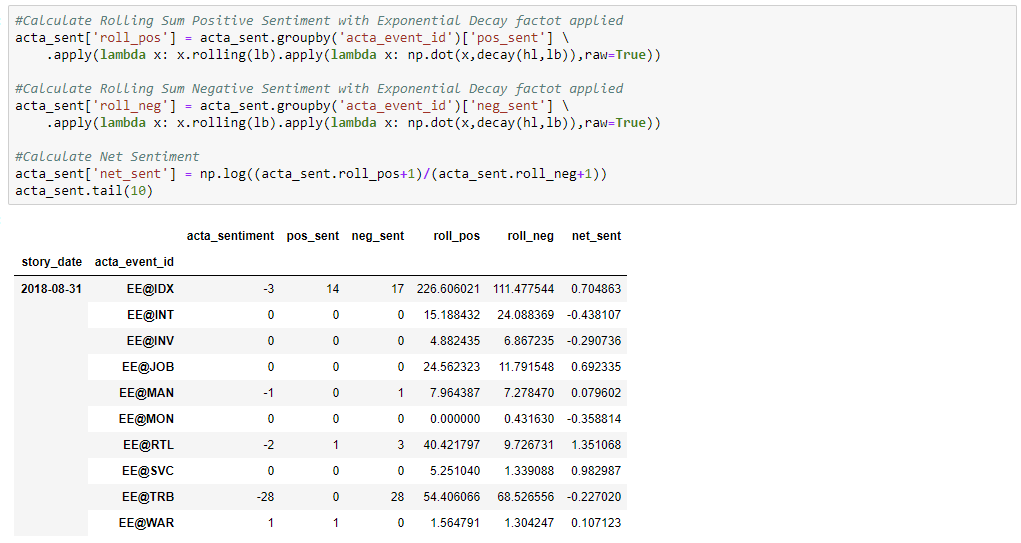
In this use case, the Net Sentiment is calculated on a per-event basis and is calculated as log((Count Positive Stories Last 30 Days+1) / (Count Negative Stories Last 30 Days + 1)). An exponential decay factor is applied to place greater emphasis on more recent stories compared to those written longer ago. Applying a decay factor allows for a longer lookback window and overall more stability while also picking up changes in sentiment more quickly than an equal-weight approach would capture.
The first step in building the daily net sentiment field is to disaggregate the sentiment field into individual positive and negative sentiment data points which are then summed daily at the event tag level. Any missing days or days with no stories are filled with 0 which allows accurate rolling statistics to be calculated and normalizes the dates across all series.

The next step is to create a daily rolling 30-day sum of positive and negative sentiments for each of the event tag series. This rolling sum is where the exponential decay factor is applied. Finally, the net sentiment factor can be calculated using the daily rolling positive and negative sentiment values.
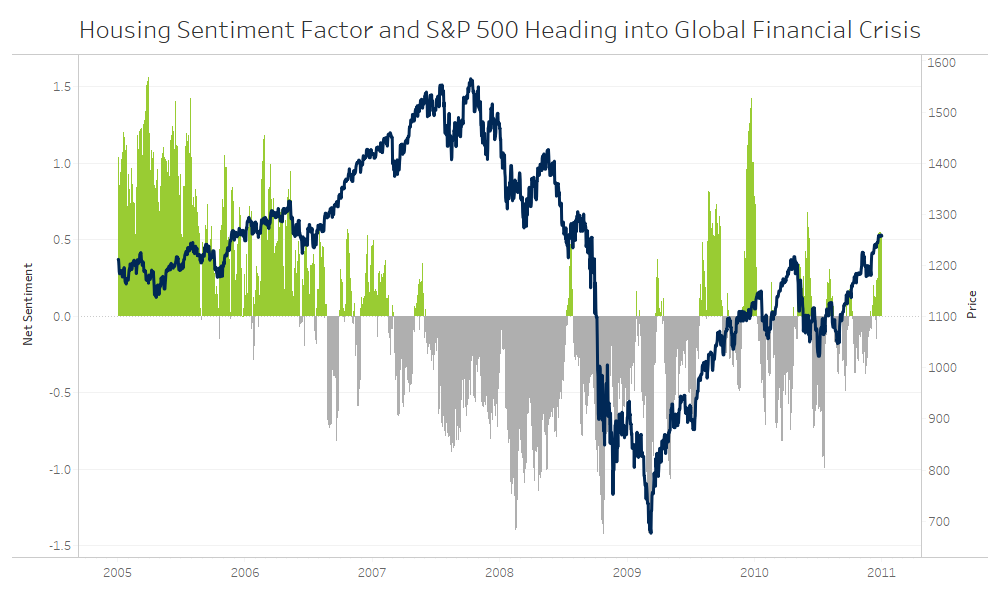
The sentiment factor scores can then be used in several interesting ways. For example, one of the more important relationships to examine heading into the Global Financial Crisis is between the United States EE@HOM sentiment factor and the broader U.S. Equity Market, represented by the S&P 500. EE@HOM represents stories related to Housing, Construction, Mortgages, and Foreclosures, which were very topical during this period. Throughout 2006 and early in 2007 the sentiment factor around EE@HOM had gone from strongly positive to strongly negative, acting as major warning flag for the sharp correction in 2008.
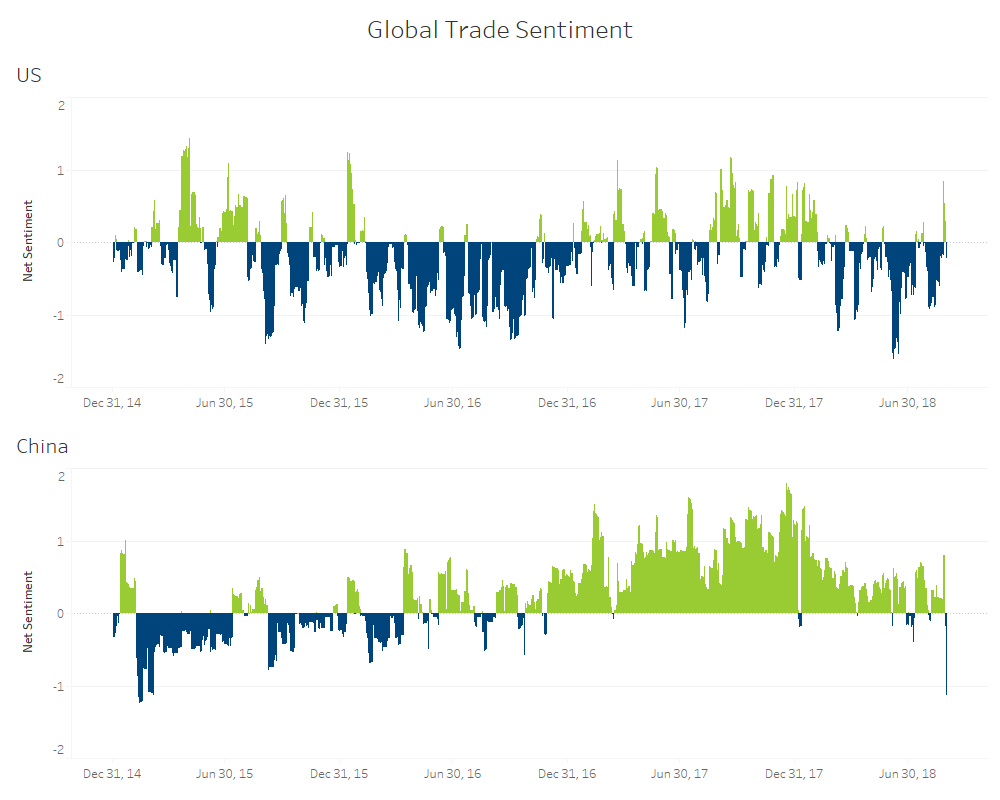
Another useful concept to examine is the relative sentiment between economies. In this example, a comparison of sentiment around Trade Balance between the United States and China shows interesting dynamics over the last few years. Sentiment around trade in the US was very negative in 2016 and has become increasingly volatile in 2017 and 2018. China also had negative Trade sentiment in 2016, but this metric moved into strongly positive territory at the start of 2017. Trade has become a major policy focus and the possibility of an escalating trade war between the United States and China has the potential to dramatically impact global markets. Alexandria offers the ability to monitor feedback on Trade sentiment to help investors understand what’s bluff and bluster compared to what might actually move the market. To date, the market has shrugged off the rhetoric of a trade war but if investor sentiment around the topic turns negative, so too might the markets and Alexandria’s advanced warning can provide investors with an opportunity to generate outperformance.
In summary, Alexandria Text Analytics - Economic data feed gives users the ability to monitor global macro sentiment across a variety of economies and specific event types. This data can provide insight into changing economic regimes, set off alarm bells before markets deteriorate, and provide investors with the tools to identify which of the world’s economies are primed to outperform. This data provides a powerful overlay to traditional factor models and can be used to enhance overall portfolio performance.
If you have questions or would like to learn more about any of the content mentioned above, please contact us at sales@factset.com.
Please visit the Alexandria Text Analytics product page on the Open:FactSet Marketplace for more information.