The Basics
ESG Book is a global leader in sustainability data and technology. Launched in 2018, the company offers a wide range of sustainability-related data, scoring, and technology products that many of the world’s leading investors and companies use. Covering over 30,000 companies, ESG Book’s product offering includes ESG raw data, company-level and portfolio-level scores and ratings, analytics tools, and a SaaS data management and disclosure platform. ESG Book’s solutions cover the full spectrum of sustainable investing including ESG, climate, net-zero, regulatory, and impact products.
The product information and content statistics contained in this document are as of January 2023.
The Applications
Use Case
|
Description
|
|
Risk Management and Reporting
|
Get a more holistic view of the various types of risk facing your portfolio and communicate about it more concisely
|
|
Fundamental Analysis
|
Gain a stronger understanding of a company’s management focus and its positioning for long-term profitability
|
|
Quantitative Management
|
Receive quantitative sustainability data points that can be easily integrated into new and existing investment models
|
|
Portfolio Management
|
Assess the sustainability characteristics of investment portfolios, track momentum of scores over time, and/or develop new screening and integration models altogether
|
The Coverage
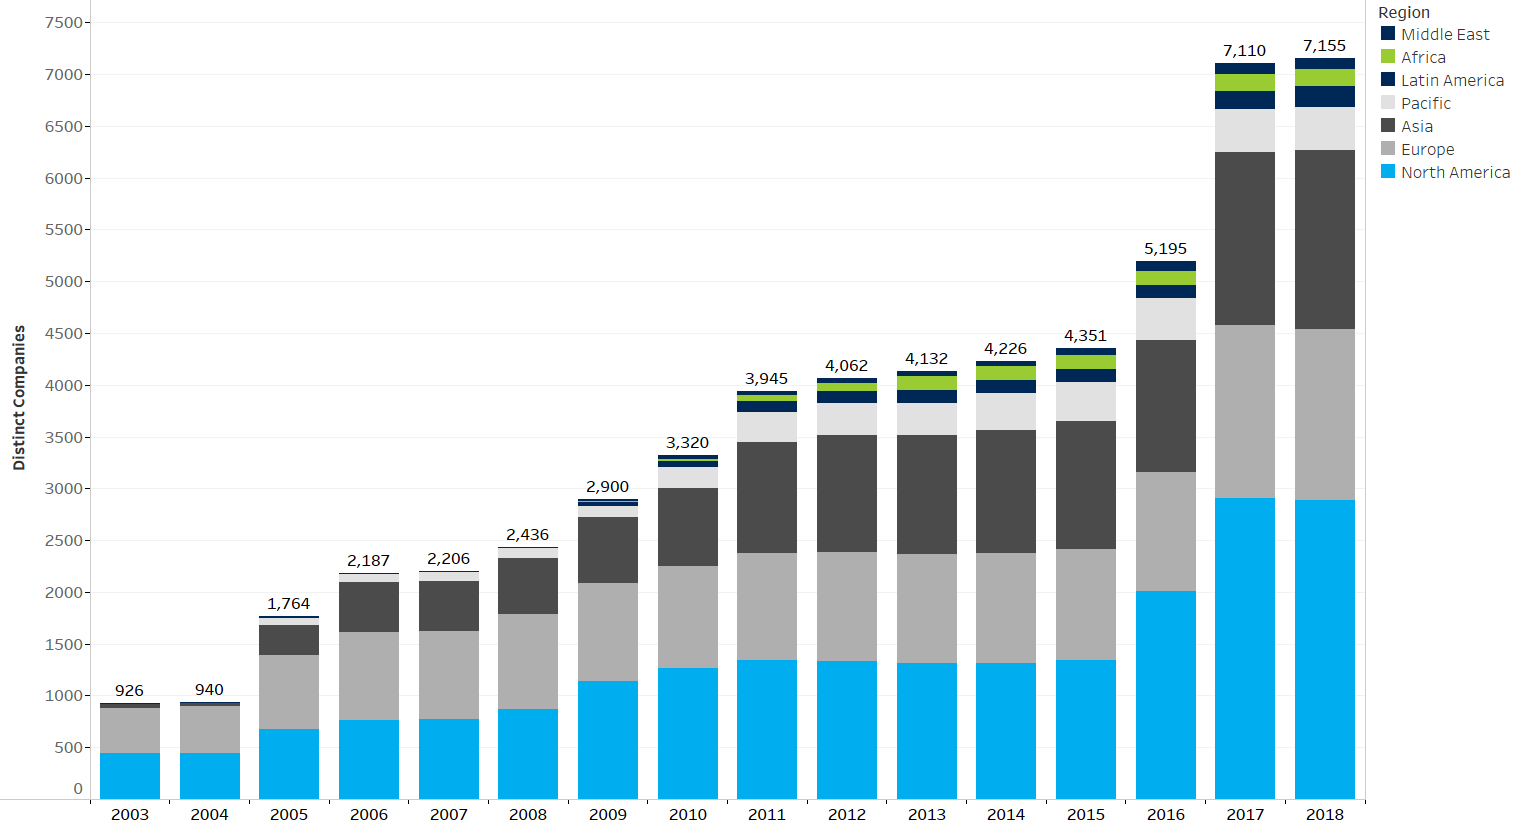
The ESG Book Data Feed covers approximately 30,000 publicly listed companies worldwide going as far back as 2003. Figure 1 depicts the total coverage over time broken out by region. The coverage encompasses over 75 countries globally.
Figure 1: ESG Book Coverage by Region
/figure%201%20esg%20books%20coverage%20by%20region.png?width=1517&height=826&name=figure%201%20esg%20books%20coverage%20by%20region.png)
Figure 2 provides coverage detail at the FactSet sector level.
Figure 2: ESG Book Coverage by FactSet Sector
/figure%202%20esg%20book%20coverage%20by%20factset%20sector.png?width=1000&height=544&name=figure%202%20esg%20book%20coverage%20by%20factset%20sector.png)
The Differentiators
The ESG Book data feed incorporates a wide range of data from two types of sources: report-based metrics and news-based controversies. For report-based metrics, ESG Book systematically combines 250+ environmental, social, and governance (ESG) metrics from non-financial disclosures (e.g., sustainability or integrated reports). As report-based metrics are only available on an annual basis, ESG Book also utilizes machine learning to scan news-based controversies from over 50,000 sources across 15 languages. This combination of short-term news stories and longer-term data sets allows for more immediate scoring capabilities.
Additional key differentiators include:
- A unique algorithmic approach that reduces the behavioral biases that can exist in more traditional data-gathering processes
- A quantitative approach to data collection that offers scale and unlocks greater data coverage and history
- The consistent addition of new inputs and alternative data sets that aid sustainability and financial metrics
The ESG Book Data Feed also provides two approaches to measuring corporate sustainability:
- United Nations Global Compact (GC) Score: the GC score provides a normative assessment of companies’ adherence to the four core principles of the United Nations Global Compact – human rights, labor rights, the environment, and anti-corruption – to approximate reputational risk. A high Global Compact score is a direct indication that the company’s values and actions adhere to the UN principles.
- ESG Score: the ESG score offers a sector-specific analysis of each company’s performance on financially material environmental, social, and governance (ESG) criteria, such as emissions and business ethics. Each criteria is weighted by its relevance to the sector the company is in.
GC and ESG scores help clients both compare a standardized metric (GC score) and consider the nuances that may arise within a given sector. For example, with manufacturing firms, environmental impact is relevant to a company’s future financial performance. In a sector such as finance, governance has more influence. ESG Book's ESG Score, which is sector weighted, considers these sector-by-sector cases.
Figure 3 highlights the differences in company-specific ESG and GC Scores for the ESG Book universe:
Figure 3: ESG Book ESG Score vs Global Compact Score
/figure%203%20esg%20book%20score%20vs%20global%20compact%20score.png?width=1000&height=758&name=figure%203%20esg%20book%20score%20vs%20global%20compact%20score.png)
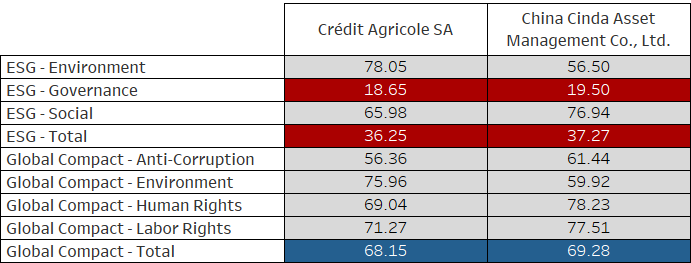
Let’s examine two companies with relatively high Global Compact Scores but distinctly lower ESG Scores to gain insight into the importance of understanding the difference between these two measures. Credit Agricole SA and China Cinda Asset Management Co. are two companies within the finance sector with low governance scores. These companies maintain a relatively high Global Compact Score, but when you consider the importance of governance within the financial sector, the sentiment around them points towards future financial risk. As the ESG Scores are weighted based on a company’s sector, the lower scores directly reflect that risk.
Figure 4: ESG - Governance and its Effect on ESG - Total
/figure%204%20esg%20governance%20and%20its%20effect%20on%20esg%20total.png?width=691&height=263&name=figure%204%20esg%20governance%20and%20its%20effect%20on%20esg%20total.png)
In addition to the Global Compact and ESG Score, the ESG Book Data Feed provides Preference Filters covering a set of 13 business involvements. These Preference Filter fields are flags within the data set that allow an end user to quickly screen companies whose business involvement in the respective field exceeds 5%. Figure 5 details the 13 Preference Filters and their coverage throughout the different sectors.
Figure 5: ESG Book Preference Filters by FactSet Sector
/figure%205%20esg%20book%20preference%20filters%20by%20factset%20sector.png?width=1000&height=611&name=figure%205%20esg%20book%20preference%20filters%20by%20factset%20sector.png)
Example Use Case
ESG Book’s Global Compact score can be used to approximate reputational risk facing companies with lower scores correlating with a higher likelihood of a company prejudicing its license to operate in the future (e.g., due to a major scandal or controversy). As such, the GC Score also provides a helpful tool to investors to address downside risk.
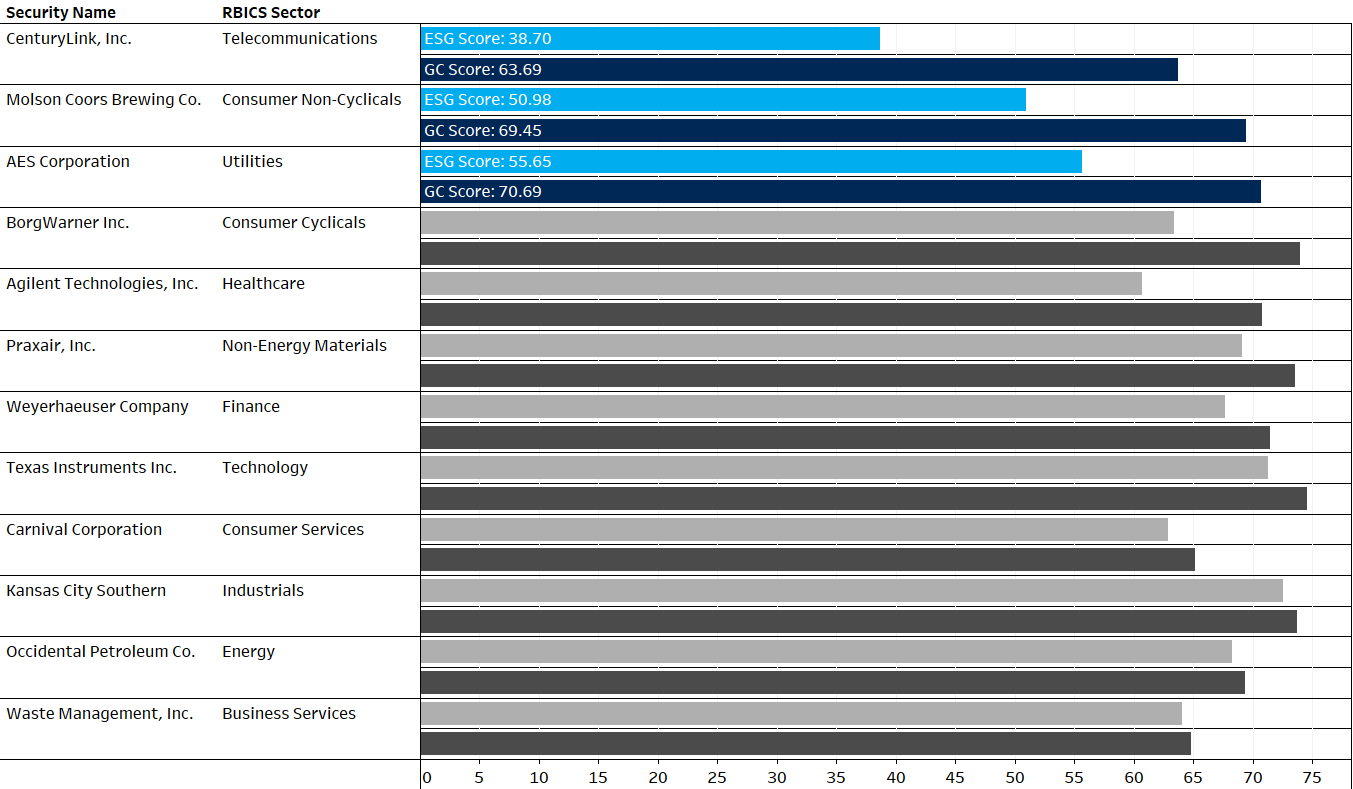
Figure 6: Top Company of the RBICS Level 1 Sectors
/figure%206%20top%20company%20of%20the%20rbics%20level%201%20sectors.png?width=1000&height=583&name=figure%206%20top%20company%20of%20the%20rbics%20level%201%20sectors.png)
The ESG Score is calibrated to improve risk-adjusted return and to identify companies that are better positioned to outperform over the long term. It is important to note that when computing the ESG Score of a company, the algorithm will only use information that significantly helps explain future risk-adjusted performance. For investors, the ESG Score may contribute towards improving investment returns over the long term.
To examine how this can be applied to a portfolio, a basket of large- and mid-cap companies can be used, identifying the companies with the highest Global Compact score within each RBICS Sector. These companies align with the values of the United Nations GC and therefore are selected with the aim of limiting downside risk.
Sorting these companies by the difference of their GC and ESG Score brings to light the three companies highlighted in Figure 6: CenturyLink, Inc., Molson Coors Brewing Co., and AES Corp. While it is arguable that they are protected from downside risk, their low ESG score scores indicate that their sustainability measures could negatively impact future financial performance.
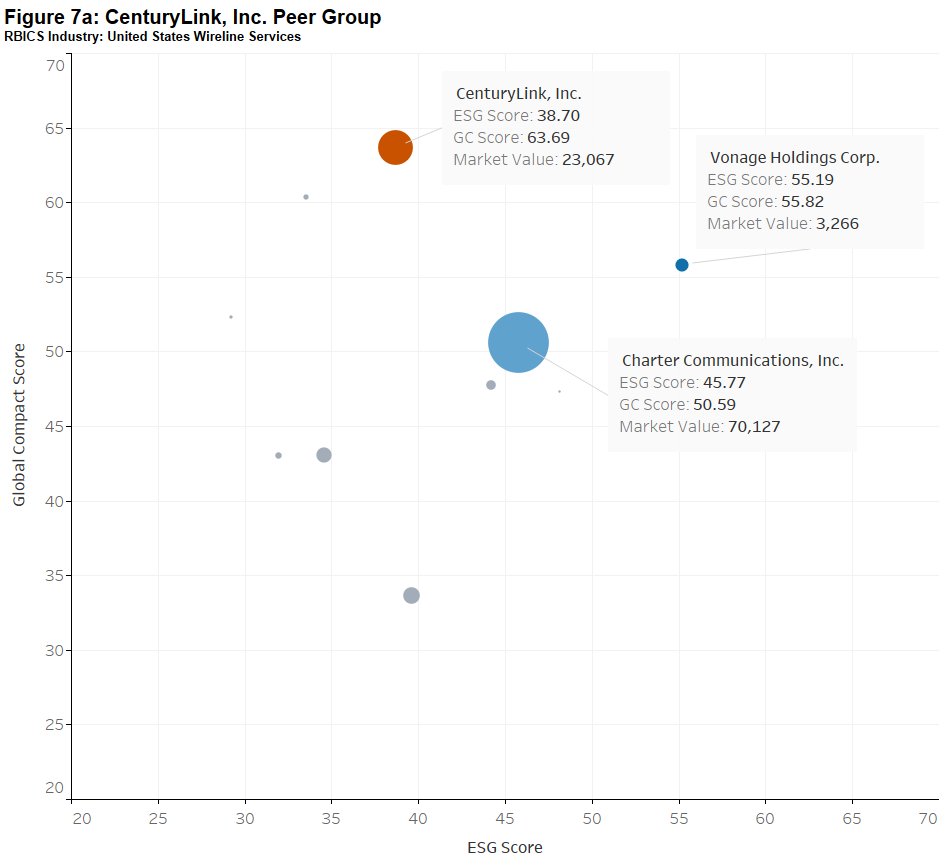
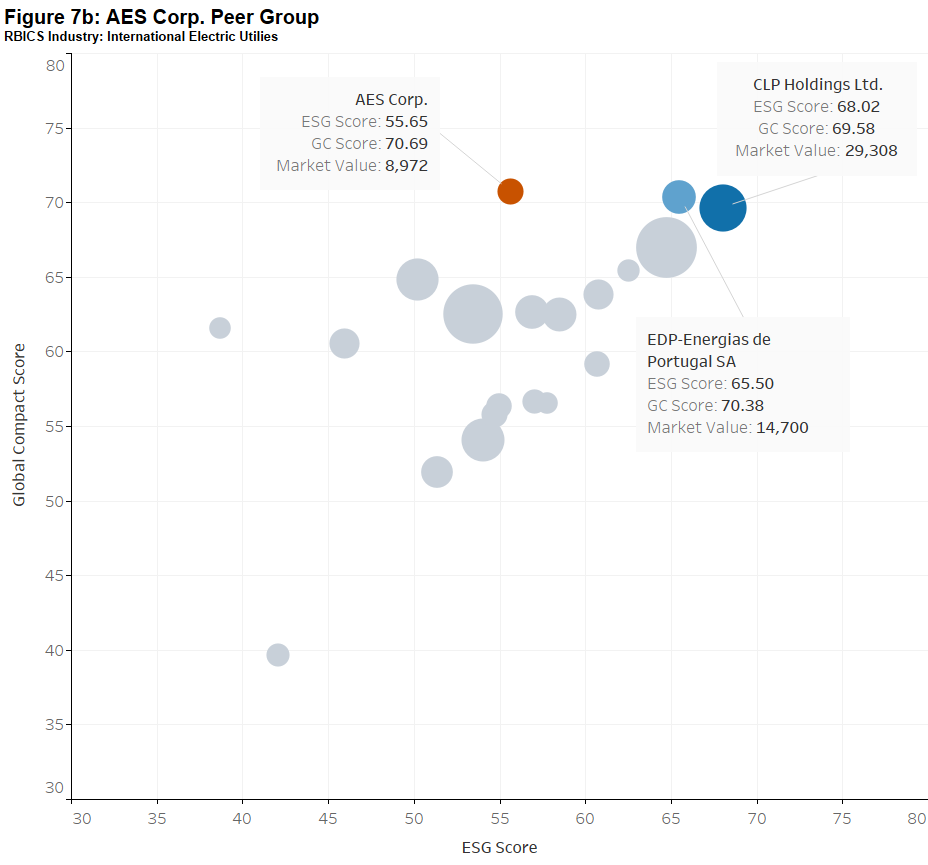
Assuming an application across a larger portfolio, one potential use-case would be to identify suitable alternatives within a well-defined peer group. Using RBICS Sub-Industry classifications, a peer universe can be generated to identify companies with a similar GC and a higher ESG Score. Figure 7 depicts potential alternatives of two securities in our mock portfolio by plotting GC (Y-axis), ESG (X-axis), and market value (bubble size).
For CenturyLink (ESG: 38.7), two options within the United States Wireline Services sub-industry are Vonage (ESG 55.19) and Charter Communications (ESG 45.77). In looking for a company to replace AES Corp. (ESG: 55.65) with another company in the International Electric Utilities sub-industry, CLP Holdings maintains a high GC Score of 69.58 and has an ESG Score of 68.02 to capture better risk-adjustment performance in the future.
ESG Book’s Data Feed analyzes the sustainability performance of a global universe of companies. Using the Scores and Preference Filters allows for a wide variety of use-cases, including but not limited to: screening on a universe to uncover companies with strong ESG principles, understanding the public perception of corporate behavior, and evaluating which companies are expected to outperform their peers.
For more information on ESG Book data, including case studies, white papers, and additional research, please visit their provider page on the Open:FactSet Marketplace.
If you have any questions, please contact us at sales@factset.com.


/figure%202%20esg%20book%20coverage%20by%20factset%20sector.png)
/figure%203%20esg%20book%20score%20vs%20global%20compact%20score.png)
/figure%205%20esg%20book%20preference%20filters%20by%20factset%20sector.png)