The Basics
Fueled by over $1.4 trillion in annual business-to-business transactions, the Cortera commercial credit bureau provides financial firms with insightful views into the characteristics of public and privately-held companies. With over 25 years in commercial credit, thousands of companies rely on Cortera to provide valuable strategic insights into customer behavior.
The product information and content statistics contained in this document are as of September 2019.
The Coverage
Cortera Spend Insights Data Feed provides coverage for 150,000 business locations in the United States that are part of the Cortera Contributor Network with data back to 2016. The universe is comprised of both public and private companies and has a concentration within sectors such as Industrials (15,000 Companies), Consumer Non-Cyclicals (7,000), Consumer Cyclicals (6,000), and Non-Energy Materials (6,000).
The Differentiators
The Cortera Credit Exchange® network delivers deep insights into potential risk, including business purchasing and payment behaviors with industry-specific segmentation. Participants of the network contribute accounts receivables data. In return, organizations can leverage the aggregated information within the network to understand what customers and prospects buy and how their buying patterns change over time. Most importantly, Cortera translates that behavior into a powerful measure of credit worthiness. This transparency allows companies to make calculated decisions in future business engagements and offers unparalleled insights into private companies behaviors.
The nature of the dataset provides investors with insights into the timeliness of a company’s payments to suppliers, the types of purchases that are being made, and most importantly the overall credit worthiness of a company. Pairing Cortera with FactSet, unlocks the power of this data for investors. Leveraging FactSet’s Symbology and Revere Business Industry Classification System, investors can conduct in-depth peer analysis across public and private companies. With the FactSet Supply Chain Relationships Data Feed, users can identify risks associated with key suppliers or customers within a network.
Example Use Case
Self-reported accounts receivable information provides an unbiased look into the behavior of companies. The downfall of Toys R Us showcases the various levels and insights Cortera can provide. In September 2017, Toys R Us filed for Chapter 11 protection. The figure below showcases the Cortera Credit Score and CPR Payment trends leading up to the filing.
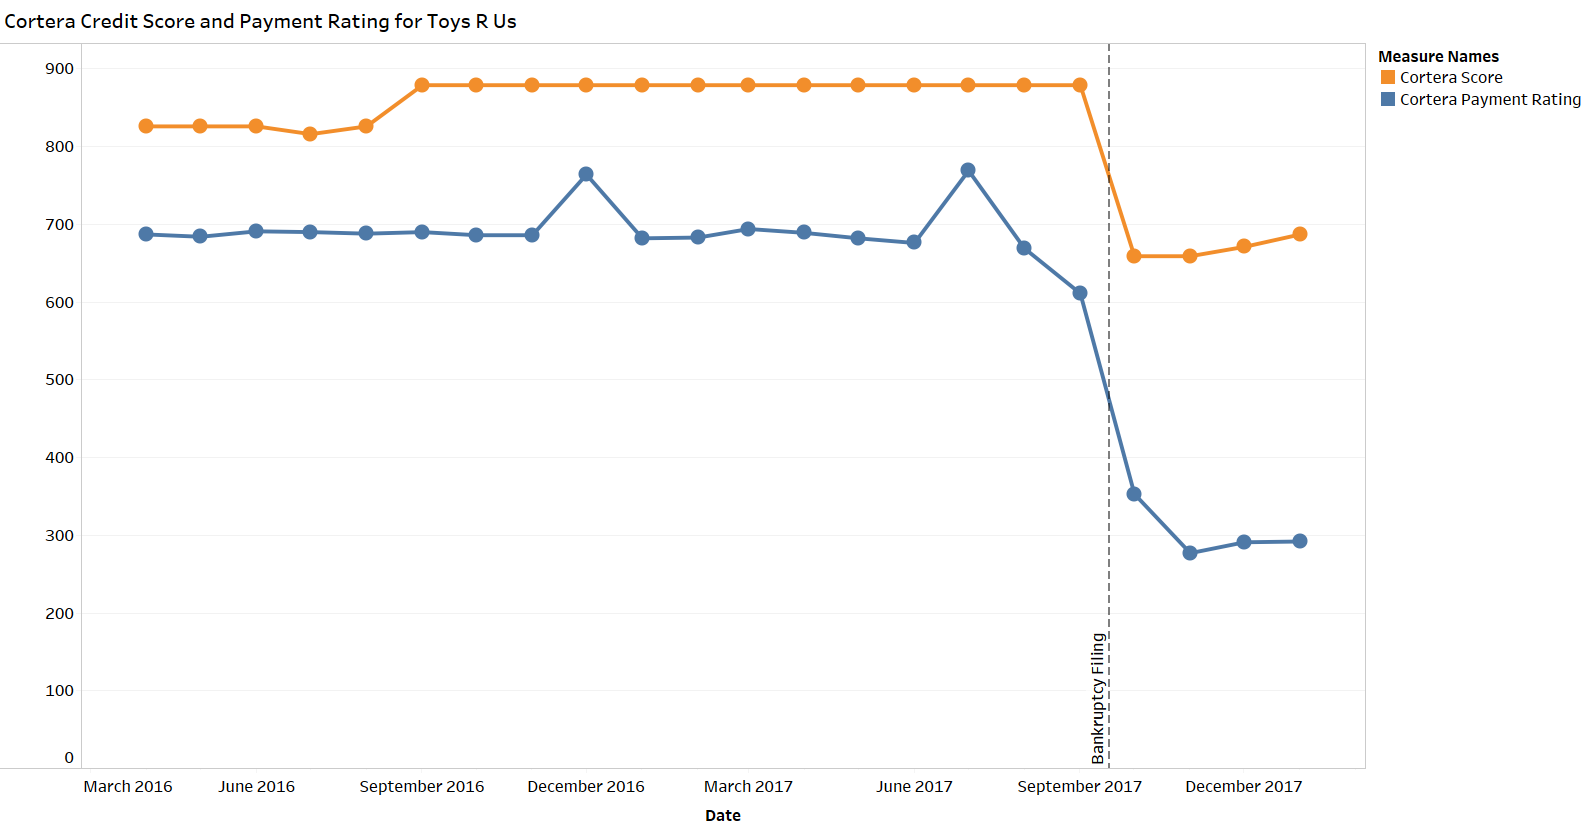
The figure above shows no behavior of a negative trend in payments or notable decline in credit worthiness leading up to the bankruptcy filing. This is not uncommon, companies will typically continue to pay key suppliers; however, we can use other aspects of Cortera's data set to predict potential issues. The bankruptcy filing contained a plan to rebrand and continue operations heading into the 2017 holiday season. With Cortera, we can track the company's spending across four primary verticals and over 40 segments. Here we can see spending ramped up in Materials heading into the filing but key areas such as Transportation declined.

Unfortunately for Toys R Us, the holiday season following the filing proved unsuccessful and lead to the closure of hundreds of stores. This also meant that suppliers who had extended credit to Toys R Us were negatively impacted. In July 2018, a settlement was reached between the various parties, however, Cortera captured the change in payment trend much earlier. The figure below shows the payment aging details based on the account receivables data for contributors in the network. Overall, the receivables days beyond term began to trend upward from 1 to 30 days to 61 to 90 days heading into the filing.
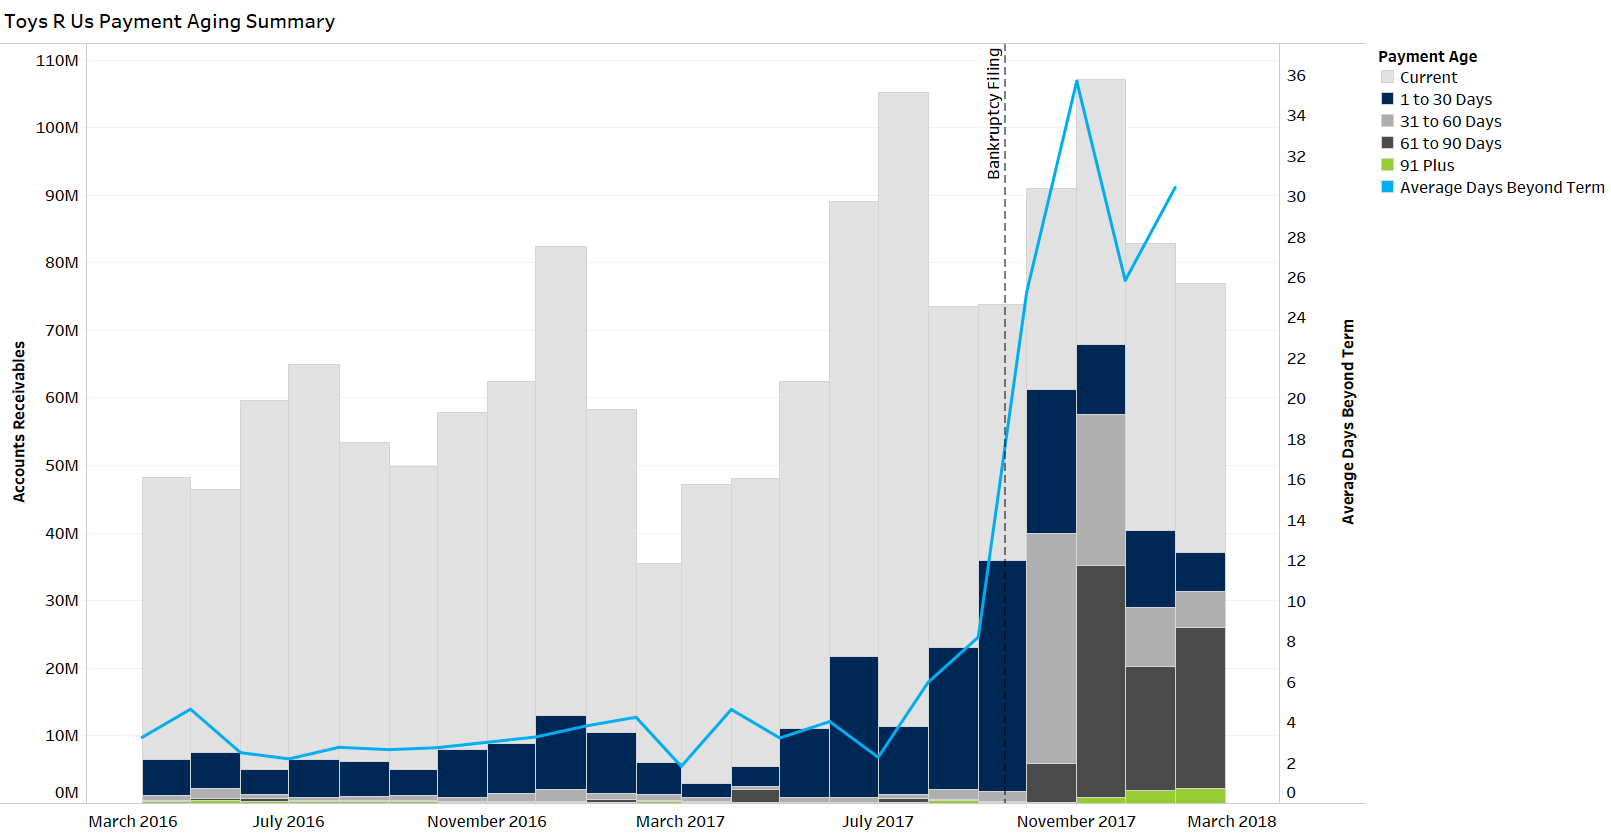
For a company such as Toys R Us, a decline in shipping spend and a slow-down in payments to suppliers can be an early warning signal for a potential slow-down in business.
Overall, Cortera’s dataset provides unique insights into timeliness of a company’s payments to suppliers, the types of purchases that are being made, and most importantly the overall credit worthiness of a company.
If you have questions or would like to learn more about any of the content mentioned above, please contact us at sales@factset.com.
Please visit the Cortera Spend Insights product page on the Open:FactSet Marketplace for more information.