The Basics
The Applications
The Coverage
The Differentiators
Example Use Case
The Basics
Company earnings calls have long been a key source of information for investors. Since the early 2000s, FactSet has been an industry leader in collecting and transcribing company events across the globe. Beginning in May of 2017, this best-of-breed content was made available via a data feed tailored to power sentiment and natural language processing (NLP) models with a new solution: FactSet Documents Distributor for Events and Transcripts.
The product information and content statistics contained in this document are as of February 2025. The statistics are calculated using Corrected transcripts. Statistics will be materially higher if calculated using Raw transcripts.
The Applications
|
Use Case
|
Description
|
|
Quantitative Research
|
Programmatically evaluate topics and sentiment during company events for both firms and individuals
|
|
Fundamental Analysis
|
Augment existing fundamental analysis by capturing qualitative information provided during company events
|
|
Risk Management
|
Systematically monitor a universe of companies to identify notable events or potential headwinds
|
The Coverage
The FactSet Events and Transcripts DataFeed covers earnings calls for companies around the world, with coverage beginning in 2000 for events and 2003 for transcripts. Coverage for securities is determined by market capitalization, exchange listings, index membership, and most importantly, client demand.
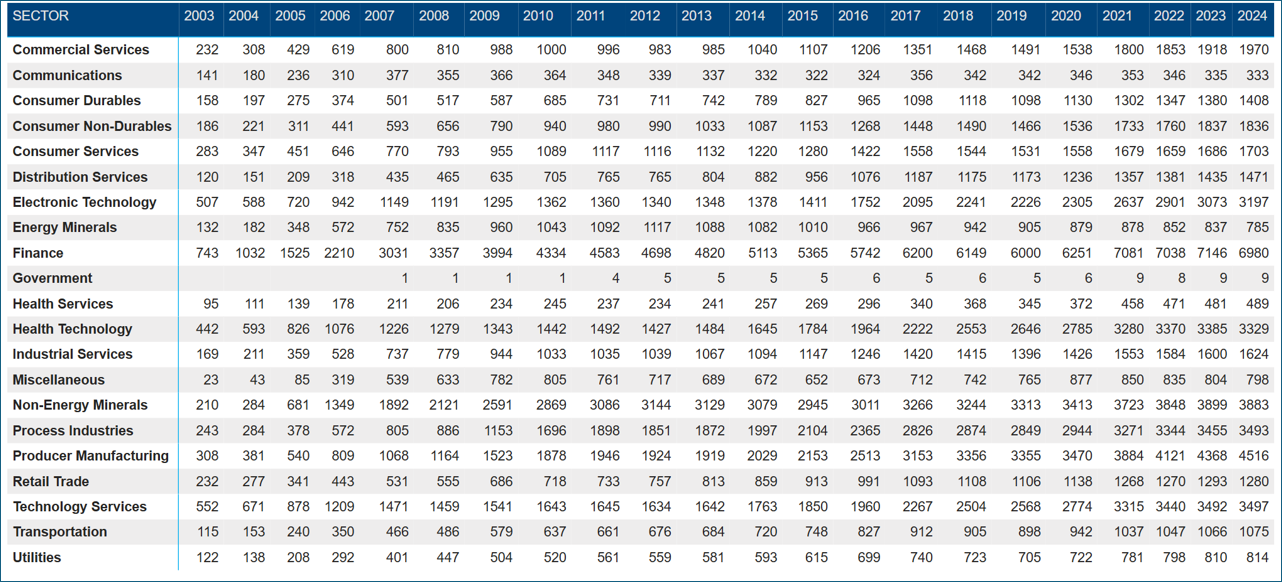
FactSet covers 40,000+ companies a year while offering transcripts for approximately 10,000 of them. To better understand the dataset, it is important to analyze coverage based on the event type, geographical regions, and company sector association. Figures 1 and 2 highlight the steady growth in the number of companies covered for both events and transcripts spanning all sectors.
Figure 1a: Companies with Events
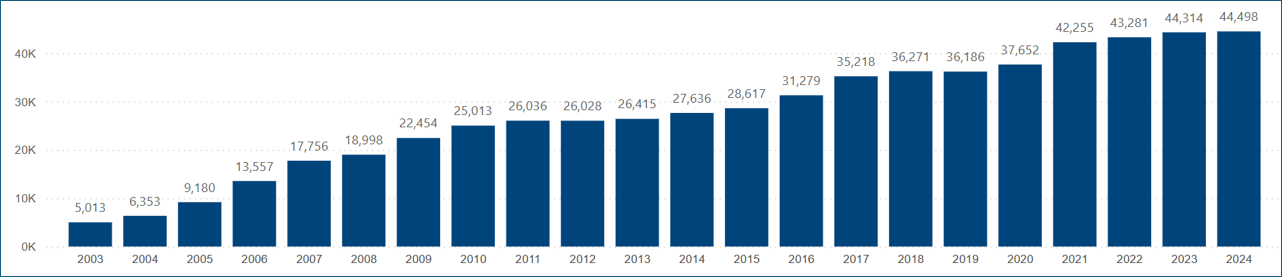
Figure 1b: Companies with Transcripts
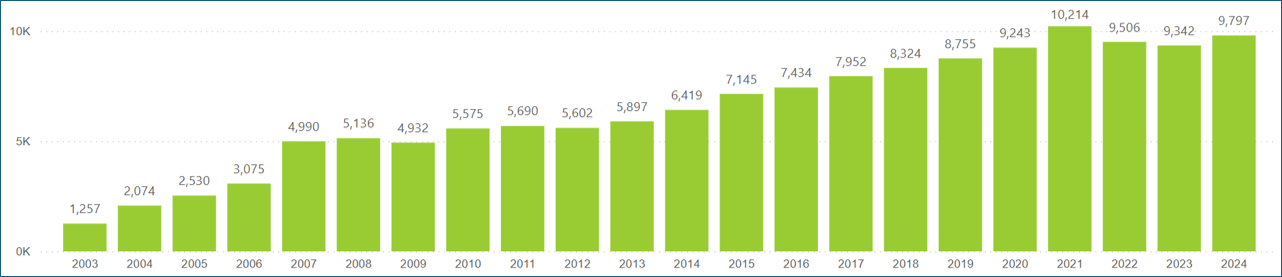
Figure 2: Company Coverage by Sector
FactSet covers six distinct event types: earnings calls, conference presentations, special situations, sales calls, analyst/investor meetings, and guidance calls. The most prominent event type, earnings calls, has a growth rate very much in line with company and event coverage (Figure 3a). Figure 3b highlights coverage for the remaining event types.
Figure 3a: Earnings Call Transcripts
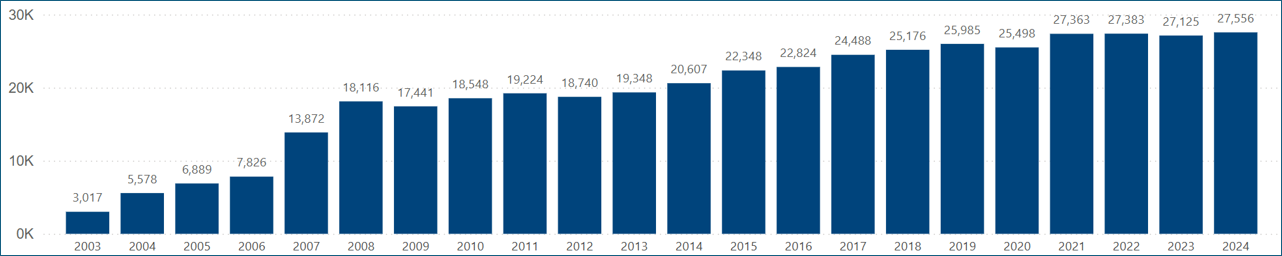
Figure 3b: Other Event Types with Transcripts

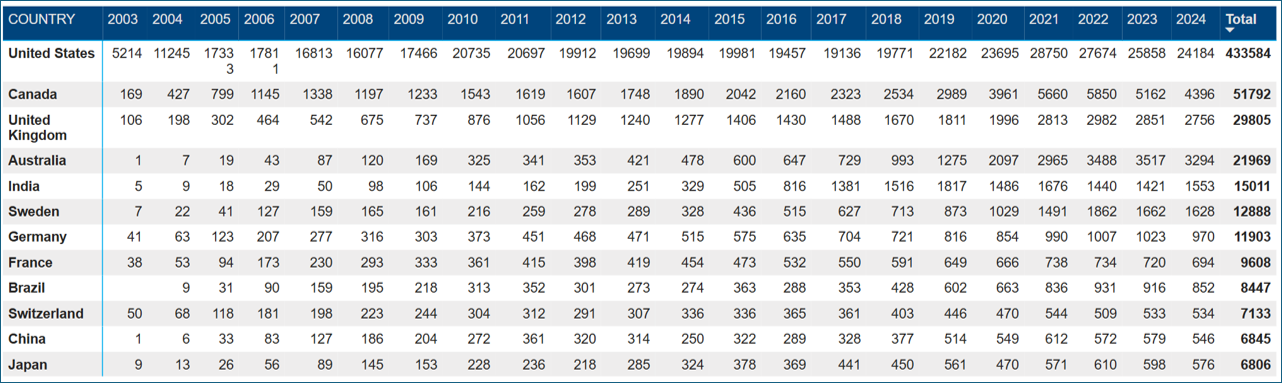
Transcript coverage is truly global and covers companies in all regions. Figures 4a and 4b show the growth in company coverage and highlights the steady growth of regions outside of North America. It is no surprise that the United States, Canada, and the United Kingdom are the leading countries when it comes to the total number of transcripts. However, Figure 4c shows the strong growth in other areas of the world in recent years.
Figure 4a: Companies with Transcripts by Region
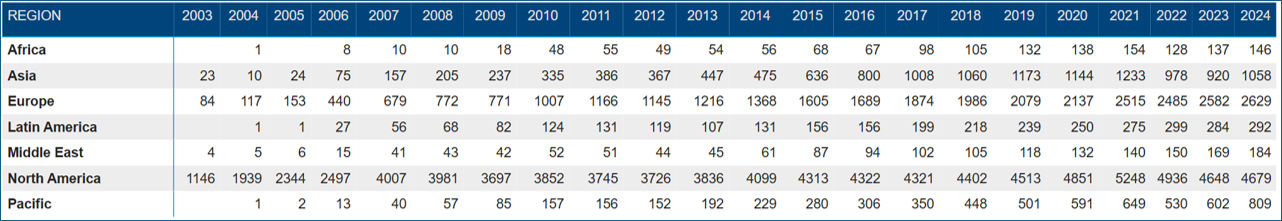
Figure 4b: Events Transcribed by Region
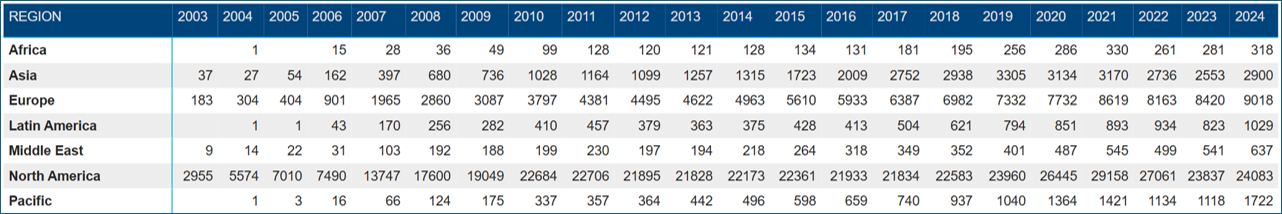
Figure 4c: Top 12 Countries Transcribed
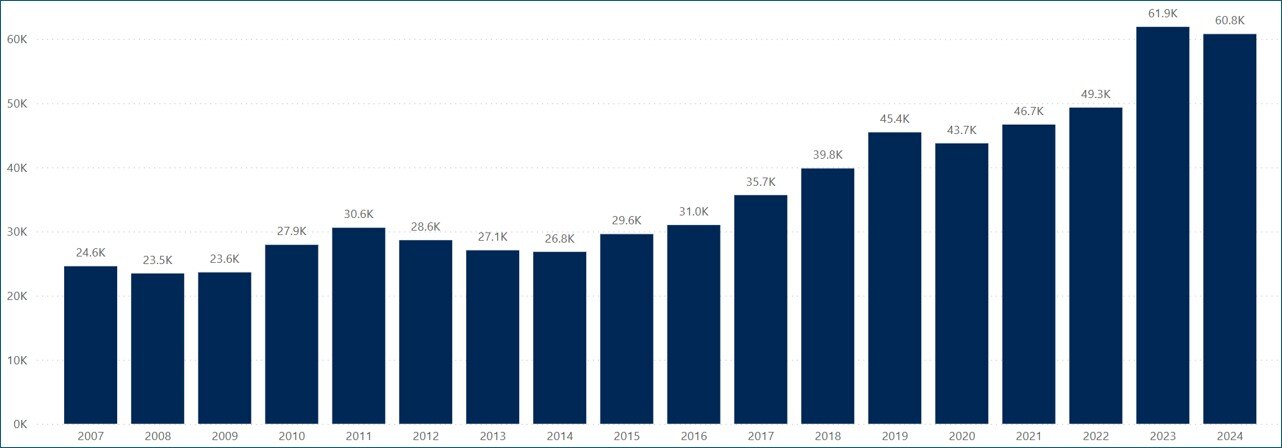
FactSet continues to increase investment in our Events and Transcripts offerings. Every year we transcribe more events and implement new technologies that improve accuracy and timeliness. Figure 5 displays the number of transcripts we produced per year.
Figure 5: Transcripts Production
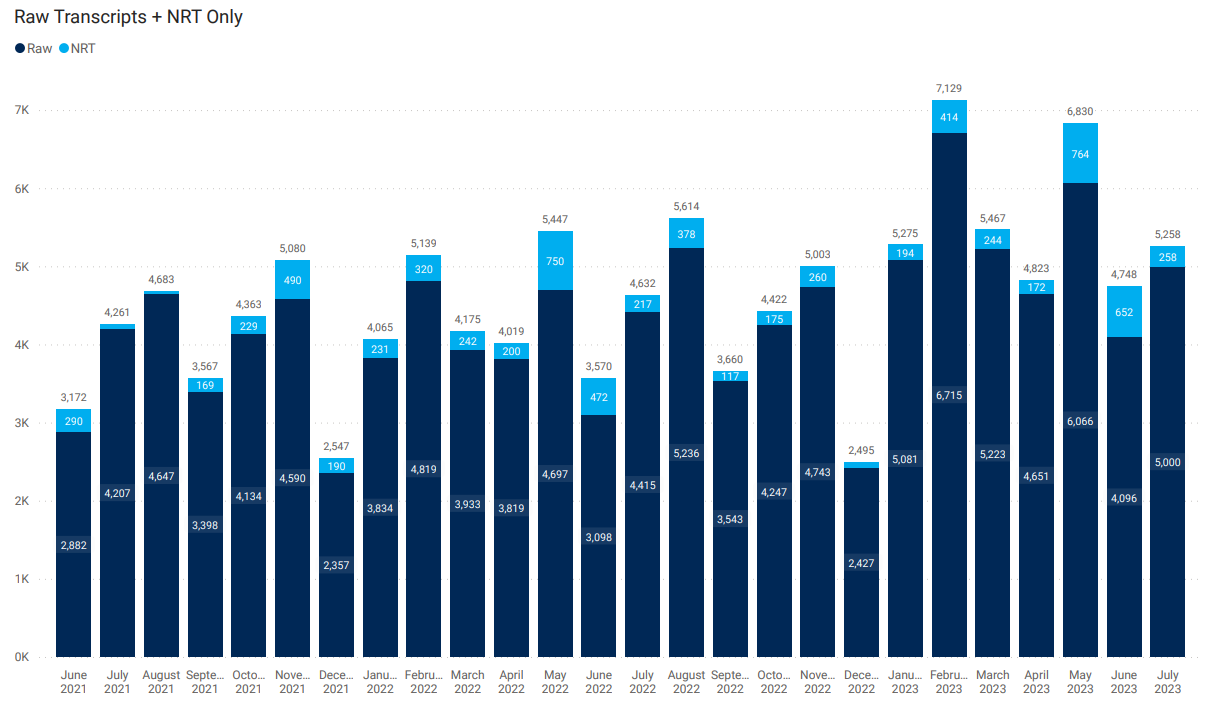
Near Real-Time Transcripts
Ask about our Near Real-Time Transcripts (NRT). Using the power of two artificial intelligence (AI) models (Speech-to-Text and VoiceID), we transcribe and identify speakers within 10 seconds of the live call. Near Real-Time Transcripts expands our XML offering while improving both speed and scope.

The Differentiators
FactSet’s Document Distributor offers transcripts and associated event metadata in a manner that is ideal for systematic analysis through three mechanisms: Document Archives, Events Standard DataFeed, and the Document Retrieval API. The Document Archives can be accessed via the FactSet Loader and provides instant access to the full history of transcripts in the form of XML documents. Accompanying the archives is the Document Retrieval API, which provides users with intraday access to the XML transcripts as they are produced.
An important feature of the archive is the inclusion of both the raw and corrected versions for each transcript. The raw version is the first to market and the corrected version is a secondary release that has been manually reviewed by FactSet’s team of analysts. By providing access to both versions, users can curtail models based on timeliness and accuracy.
Additionally, FactSet brings structure to unstructured content by standardizing and flagging key sections in each transcript. Transcript participants are mapped to FactSet Symbology, allowing users to perform historical analysis on firms, corporate participants, and analysts using FactSet’s permanent identifiers. FactSet Symbology connects transcripts with other FactSet datasets, instantly enabling deeper, more thorough analysis. Figure 5 highlights how each participant is associated with their employer (affiliation), their employer’s permanent identifier (affiliation entity), and their permanent person identifier (entity).
Figure 5: Participant Associations

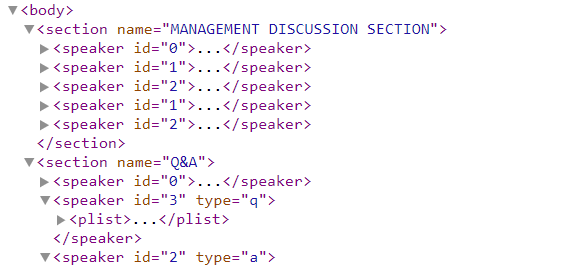
The XML structure presented in Figure 6 showcases the tagging associated with each element of the call: management discussion, question and answer, the speaker, and the type of interaction (type q is for question and a is answer).
Figure 6: XML Structure

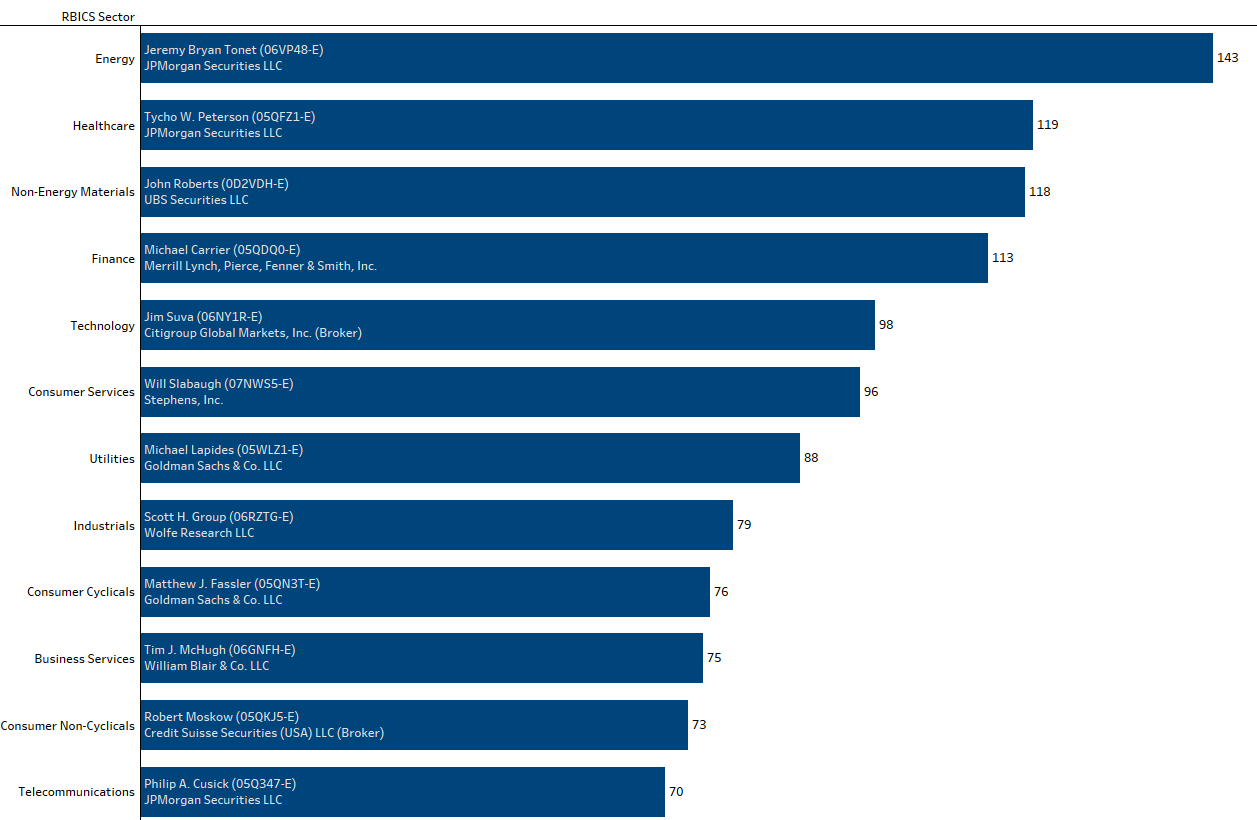
The last component of the product is access to FactSet’s Events Standard DataFeed, which contains historical and forward-looking metadata associated to company events ranging from event type, date, time, and participant information. The CE_PARTICIPANTS table aggregates event participants for all calls from May 2012 to present day (May 2012 is when FactSet began tagging transcript with FactSet People Identifiers). Without having to enter an XML transcript, users can explore the linkages of events, companies, and participants. For example, Figure 7 shows how you can leverage this table by depicting the most active analyst participants by industry in 2017 (for each analyst, the FactSet Person Identifier is included alongside their name).
Figure 7: Most Active Analysts in 2017 by RBICS Sector
Example Use Case
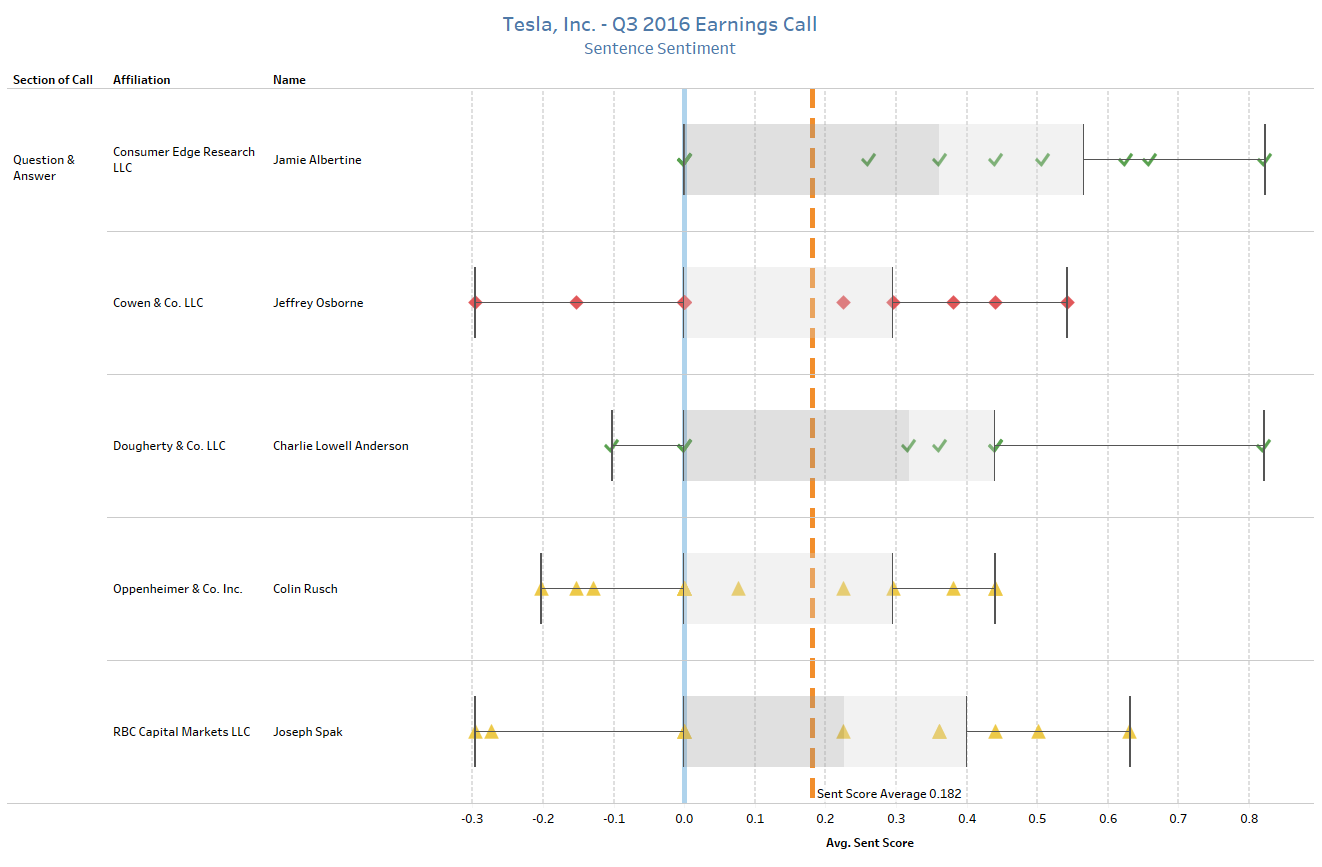
A common approach with unstructured content is to calculate a sentiment value. A simple but relevant example of this application can be achieved by analyzing Tesla’s third quarter earnings call from 2016, using a combination of FactSet’s XML Transcripts and an out-of-the-box NLP package in Python.
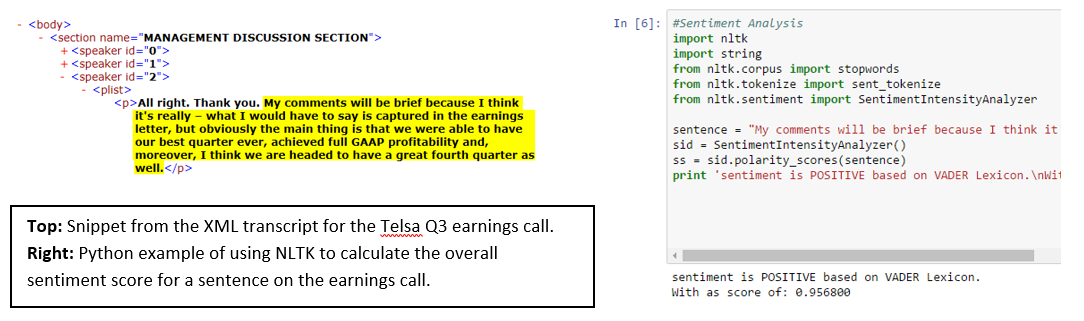
By using machine-readable files alongside Python’s Natural Language Toolkit package, the call can be diagrammed to identify how the sentiment of Elon Musk’s comments changed between the Management Discussion section (the prepared remarks) and the Question-and-Answer section (off the cuff). Figure 6 shows the sentiment of the call, which has been quantified by leveraging a popular NLP algorithm known as the VADER model. The average sentiment of the call was positive, with a score of approximately 0.2 (orange dashed line), but the range of values varied quite dramatically from the Management Discussion to the Q&A, where the tone of the call took a turn for the worse upon mention of recent fatalities involving Tesla’s Autopilot.
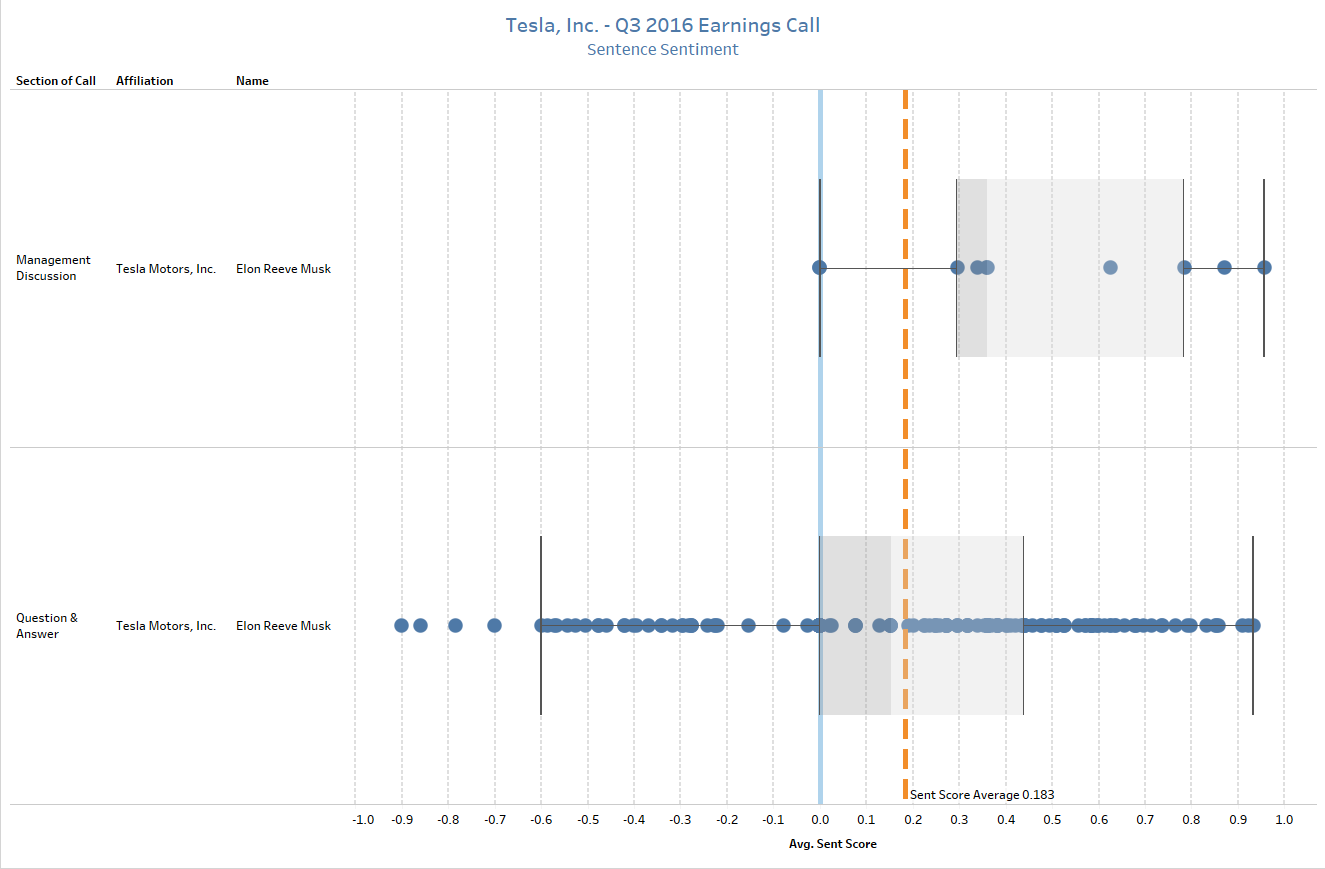
A simple script like this addresses a critical challenge facing fundamental investors. In this scenario, an analyst would be able to receive an output from this call and immediately understand the average tone, notable headwinds, and if other analysts are overly bullish, bearish, or neutral. That type of intelligence allows analysts to create a benchmark that can be cross-referenced across their coverage list, in turn allowing them to allocate their time accordingly. In other words, if Tesla’s overall tone was positive, it may signal that more time could be directed to other ideas or calls where the outcome was more varied.
Shifting to the Question-and-Answer section, the same sentiment analysis can be performed on the questions asked by analysts. Combining FactSet Symbology and FactSet Estimates - Detail databases, supplemental context can be added by comparing sentiment and the analyst’s recommendations on Tesla heading into the call.

Following the same methodology as above, we plot out the sentence for each analyst. Red diamonds represent analysts with a sell rating, yellow triangles represent holds, and green checks are buys.
The ability to blend unstructured and structured content seamlessly is crucial for a quantitative investor. By leveraging FactSet Symbology at the individual level, it facilitates the exploration of patterns and trends at a more granular level comparing Transcripts and Estimates. For example, are companies more likely to call on analysts with favorable ratings after or before a down quarter? Are analysts who participate on company earnings calls more accurate than their peers who do not? This example highlights how symbology at the individual level unlocks the ability to augment or enhance existing models.
By employing an algorithm to do the work, these techniques can be applied across a full history of transcripts to see how language, participation, and affiliation can serve as leading indicators for future performance. Approaches like this can enhance existing factors or introduce efficiencies to the often-manual task of listening to earnings calls.
If you have any questions or would like to learn more about any of the content mentioned above, please contact us at sales@factset.com.
Please visit the product page on the Open:FactSet Marketplace for more information: FactSet Document Distributor - XML Transcripts.