Contents
The Basics
The Applications
The Coverage
The Differentiators
Example Use Case
The Basics
Many equity specialists believe that company earnings play a vital role in equity investment analysis and subsequent performance. Classes of active equity managers employ strategies that seek superior forecasts of future earnings and earnings growth. For example, firms may incorporate measures of earnings acceleration, revisions to consensus estimates, or the rate and magnitude by which companies beat their consensus expectations into their quantitative or qualitative stock selection process. Firms favor stocks with upward consensus earnings revisions when the more accurate analysts’ estimates are also above consensus. It is readily apparent that advisers who employ earnings estimates would benefit from better data, both at the consensus and superior analyst levels.
Historically, consensus earnings estimates have been based on sell-side analyst reports. However, a long list of industry and academic research going back several decades finds that sell-side consensus and revisions are less than accurate reflections of the true expectation of the market. This inefficiency may be influenced by a cognitive error in the analysts’ thinking. In addition, some market participants believe that many companies encourage conservative earnings analyst estimates in order to increase the probability of positive earnings surprise. Knowledgeable investment advisers look beyond consensus sell-side estimates to assess the true prospects for upside, or downside surprise.
The accuracy of crowds has been widely covered in the scientific community from statistician Francis Galton to more recent works by Philip Tetlock and others exploring the applications in economics, management, and psychology. Most research has shown that crowds have the greatest advantage for predictions that have a defined answer or are based on mathematical concepts.
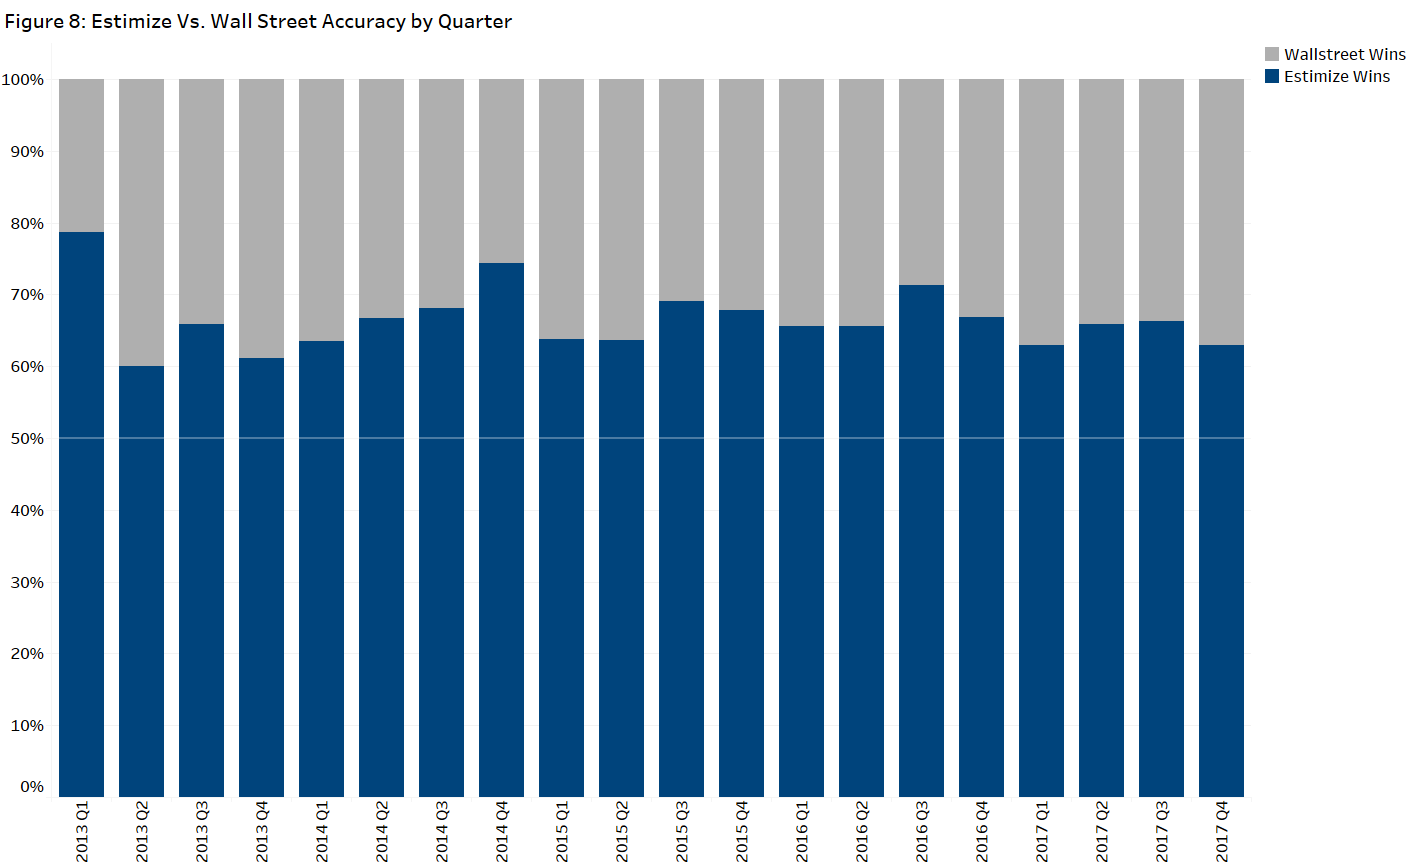
Estimize applies these principles, along with research, into the behavior of people in public goods markets, from Nobel Prize winning economist Richard Thaler to financial earnings announcements, by sourcing predictions from a wide range of contributors—hedge fund, brokerage, independent, students, and amateur analysts. In return for an individual’s contribution of a specific estimate, that individual is provided with free access to the pseudonymous estimates of their peers for that specific earnings report. Contributors of Estimize face reduced regulatory pressure, resulting in more timely estimates compared to the Street. The byproduct of creating a data set that is more representative of market expectations is that it is also more accurate, beating sell-side only data sets 63% of the time.
The product information and content statistics contained in this document are as of March 2018.
The Applications
Use Case
|
Description
|
|
Pre-earnings Drift
|
Differences in the Estimize and Wall Street consensus numbers in the two weeks prior to each earnings report provide statistically significant arbitrage opportunities. More information on this application can be found in the Example Use Cases section.
|
|
Post Earnings Drift
|
The classic PEAD model so widely used on Wall Street estimates works even better using Estimize data to benchmark for the true measure of whether and by how much a company exceeded or missed estimates.
|
|
Risk Management
|
Prevent losses by identifying stocks at high risk of negative returns around earnings. The Estimize dataset can lower the volatility and increase the Sharpe of longer-term strategies by excluding high dispersion names from the portfolio. More information on these applications can be found in the Example Use Cases section.
|
|
Portfolio Management
|
At the end of the day, the job of a fundamental analyst is to have a differentiated view on the future fundamentals of a stock relative to market expectations. This delta is theoretically the alpha an analyst can generate if correct. By using the Estimize Consensus, analysts can benchmark their own expectations against what is truly being baked into stock prices by the market, instead of having to guess at the level of bias from the Street estimates. Especially around the announcement period, when understanding how much of a stock’s recent movements are the cause of rising or falling expectations, the Estimize Consensus can be a crucial tool in evaluating where expectations truly stand.
|
The Coverage
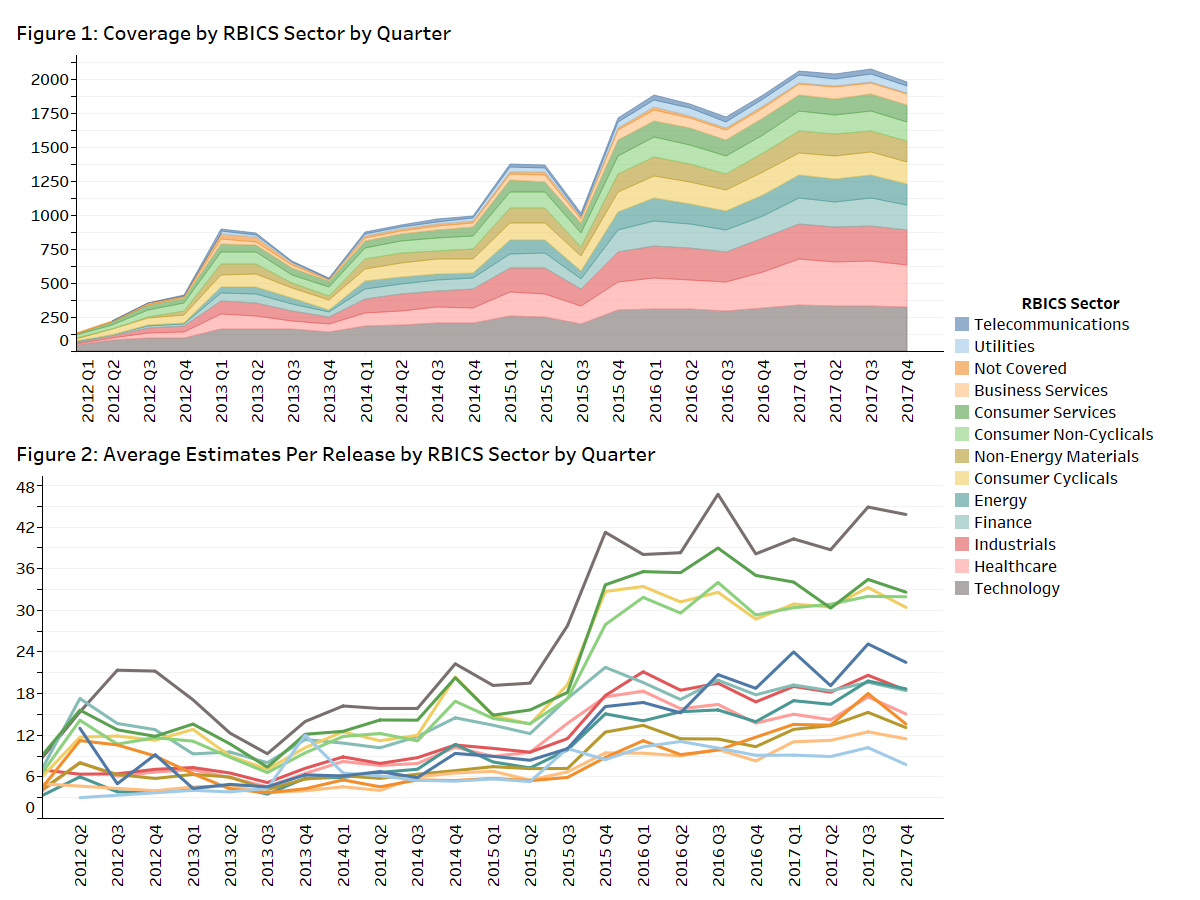
The Estimize U.S. Equities Data Feed for EPS and Revenue estimates covers over 2,600 U.S. companies closely mirroring the constituents of the Russell 3000. Figures 1 and 2 show coverage and depth by FactSet’s RBICS Sector classification. Figure 1 breaks out the growth in coverage by sector since Estimize began collecting data in January of 2012, while Figure 2 shows the average number of estimates per release by sector. It is no surprise that Estimize’s diverse array of contributors ranging from professionals to higher education students are drawn to sectors with both a higher media profile and implied volatility profile.
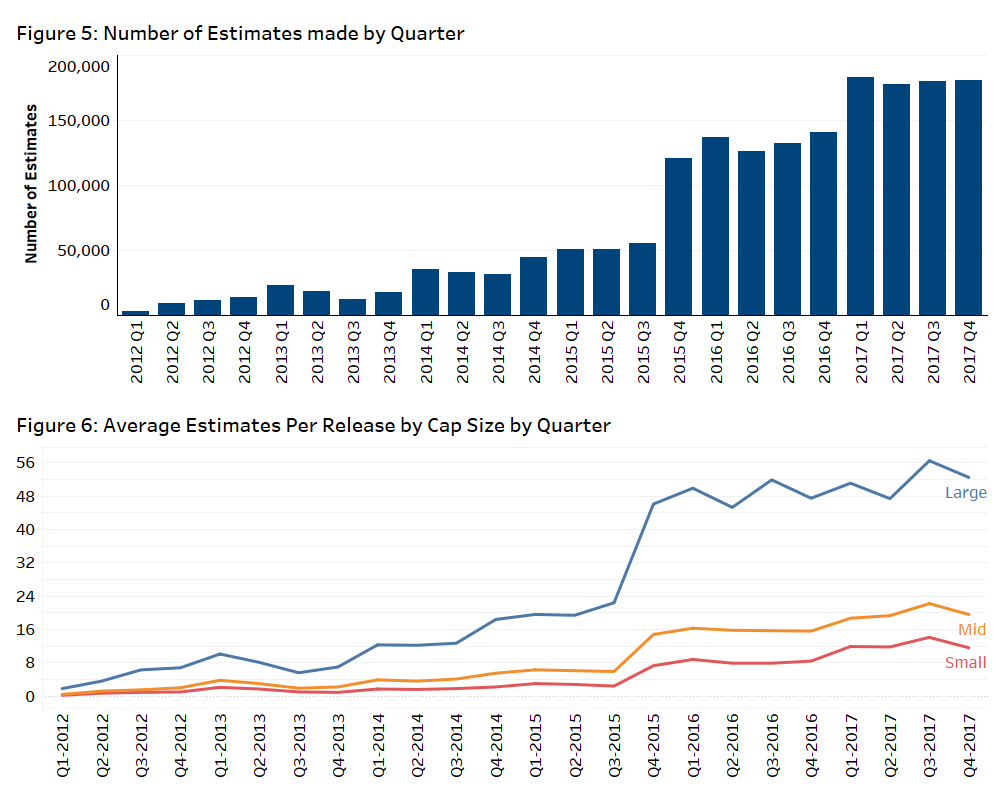
Examining Estimize’s coverage through time showcases their explosive growth in both the number of securities covered and the number of active contributors. Figure 3 provides a quarterly snapshot of the number of companies with an active consensus estimate. The undulations can be explained by both the behavior of contributors and the quarters companies report (more on this below in “The Differentiators” section). Focusing on coverage and adoption, these graphics show that Estimize is continually growing in both scope and active contributors. Figure 4 shows quarterly coverage by market capitalization (small, mid, large). Figure 5 depicts the rise in active contributors over time as the platform’s profile amongst the buy side and broader financial community has risen, while Figure 6 breaks down the average number of quarterly estimates per release by cap size.
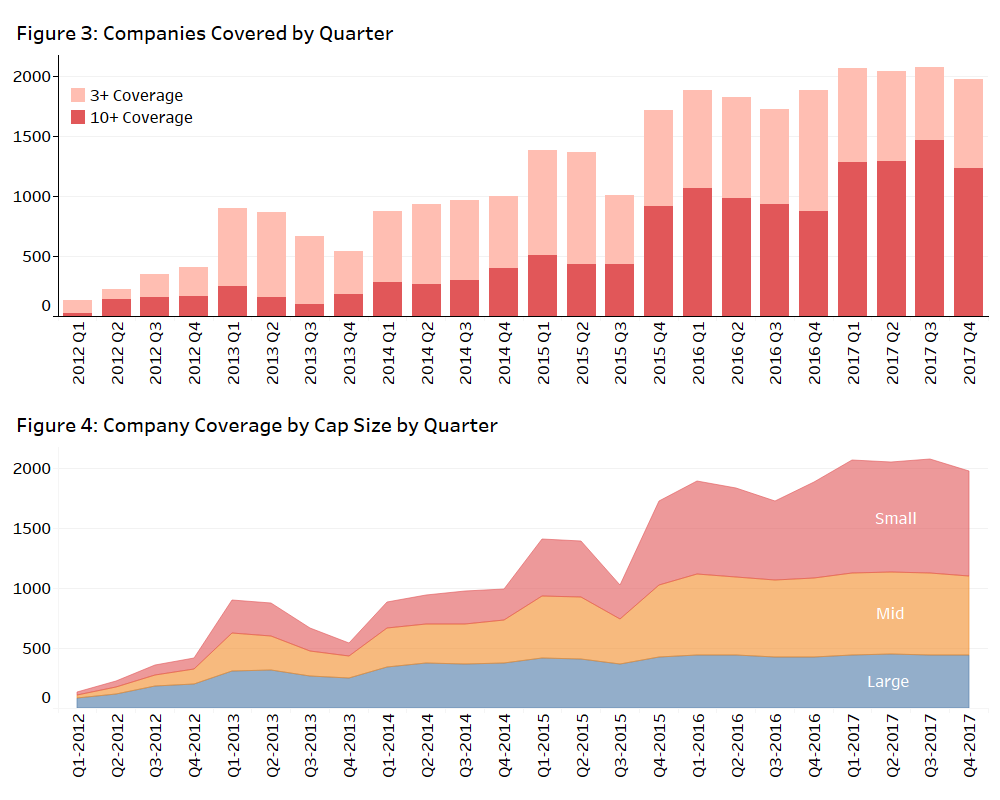
Additionally, across the full content set the median number of securities “covered” by a contributor is approximately five. This suggests that most active contributors are more than causal users but dedicated to tracking a small group of companies.
The Differentiators
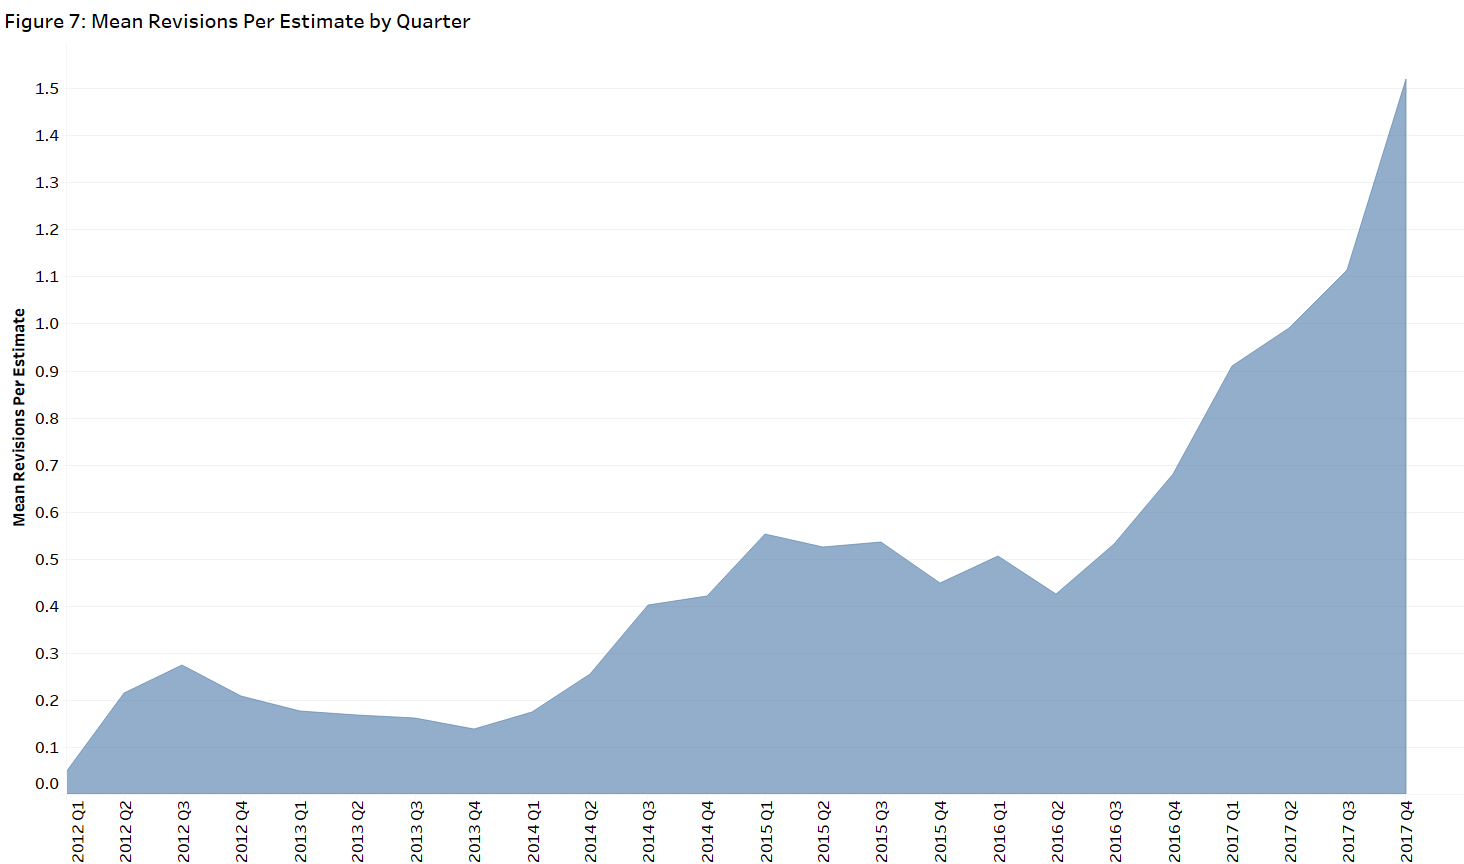
Beyond coverage and history, the key factor in evaluating Estimize’s content is if crowdsourced estimates provide an advantage relative to the Street. Figure 7 shows the average number of revisions per estimate. Contrasting this behavior with the Street, an analyst’s revision patterns are much less frequent especially as the announcement date nears. Ilan Guttman [Guttman 2009] attributes this behavior to an analyst maximizing the payoff from “selling” her forecast. As the earnings announcement date approaches, there is an increase in publicly available information, especially from other companies within the same industry which have reported, which decreases the value of a sell-side analyst’s insights to a client. Estimize’s contributors are motivated by accuracy and in turn adjust estimates as needed.
Estimize provides both a mean consensus and a more refined weighted value that considers recency, analyst historical accuracy, and other factors. When compared to the Street in the sample from January 2012 – December 2017, Estimize performed impressively—producing a more accurate estimate over 63% of the time.
Example Use Cases
Pre-Earnings Drift
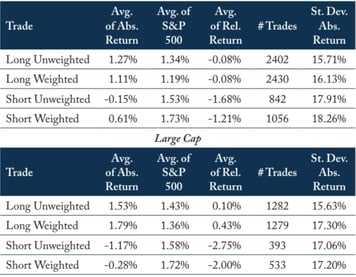
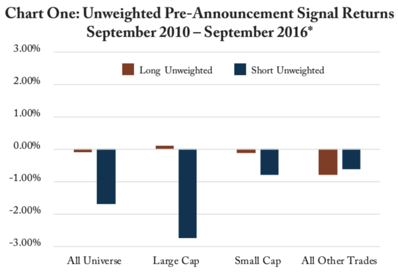
Research from McKinley Capital Management found that negative deviations in deltas (where Estimize was below Wall Street) were more significantly reflected in the price of the stock. On average, those names underperformed the S&P 500 by -168 bps on an unweighted basis and -11 on a weighted basis. Large caps (Russell 1000) showed even larger negative returns of -274 bps for unweighted estimates and -200 bps for weighted estimates.
Figure 9 Figure 10
Read more about McKinley’s findings in “Improving Earnings Forecasts with Estimize Crowd Sourced Data” found on the Open:FactSet Marketplace.
Post Earnings Drift - Event Study
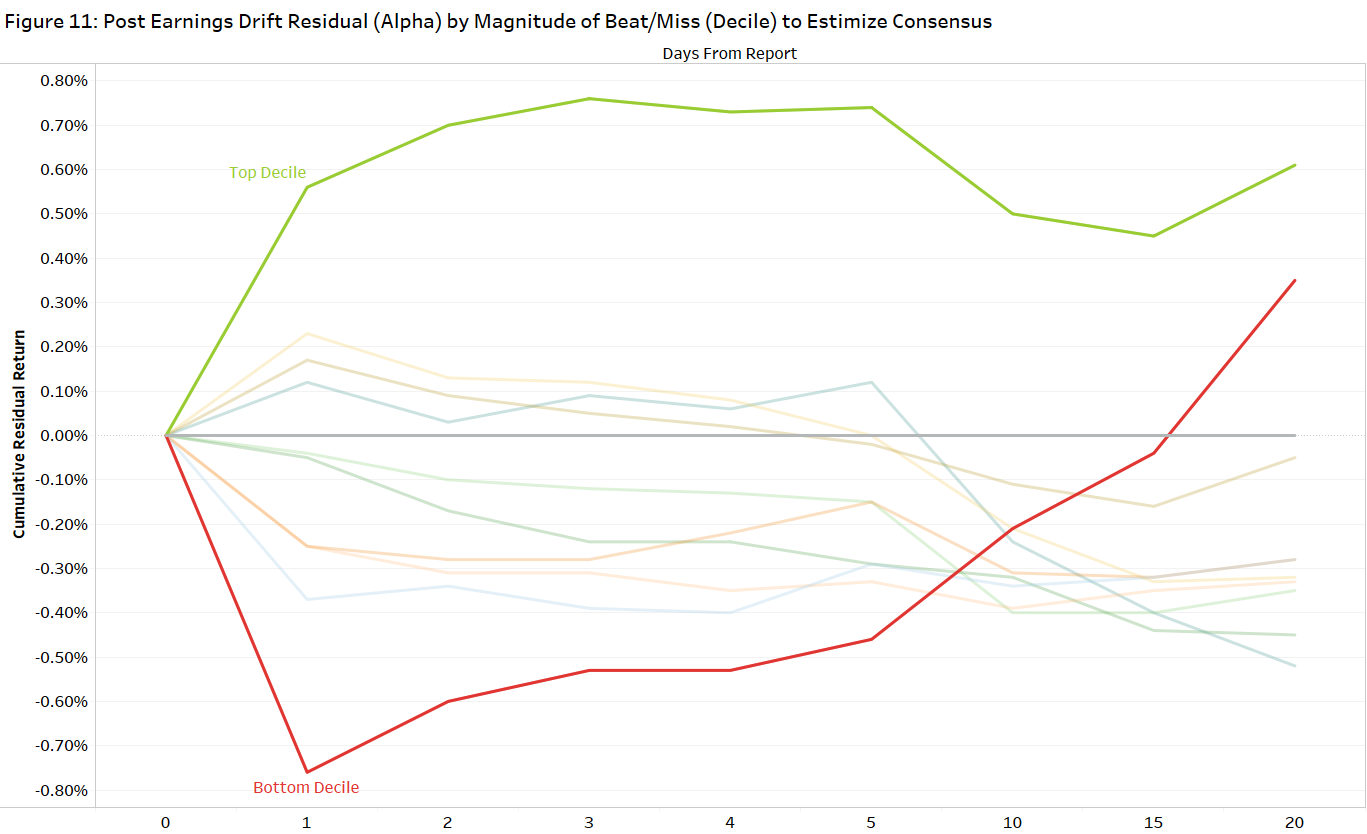
The chart below represents just one example of Estimize’s data within a post-earnings announcement drift model. The study showed companies that beat (miss) their Estimize Consensus by a significant amount tend to drift in the direction of the beat (miss), a trend that begins at the open of trading immediately after the report. Going long (short) on the companies in the top (bottom) decile (about 400 per quarter) means you can produce about 75 basis points of pure alpha in each trade (hold three days on the long side, one day on the short side). For the names with the biggest misses, go long one day after the report, and you can produce another 100 basis points of alpha over the next 19 days. The full results and source code can be found here.
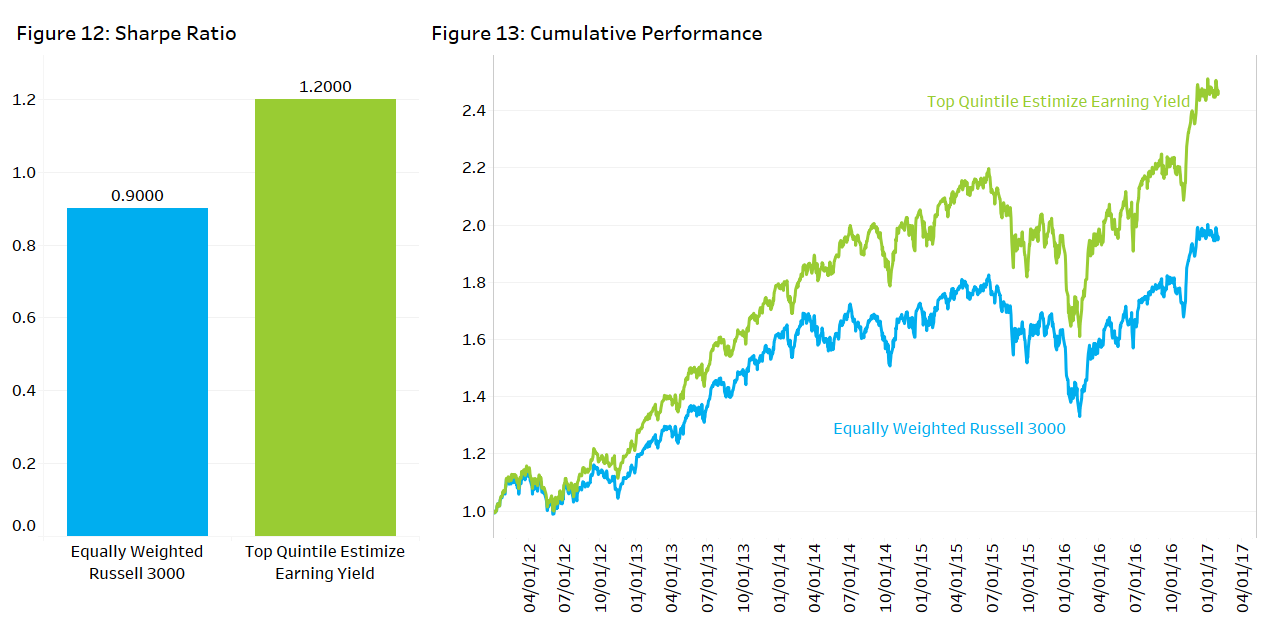
Enhanced Earnings Yield
Earnings yield is a classic quality factor that firms can use in their quantitative stock selection process. The Estimize Earnings Yield model delivers consistent alpha and improves Sharpe by 30% against the broader index. In this portfolio long-only model, companies in the top quintile of the highest earnings yield names are selected and rebalanced quarterly.
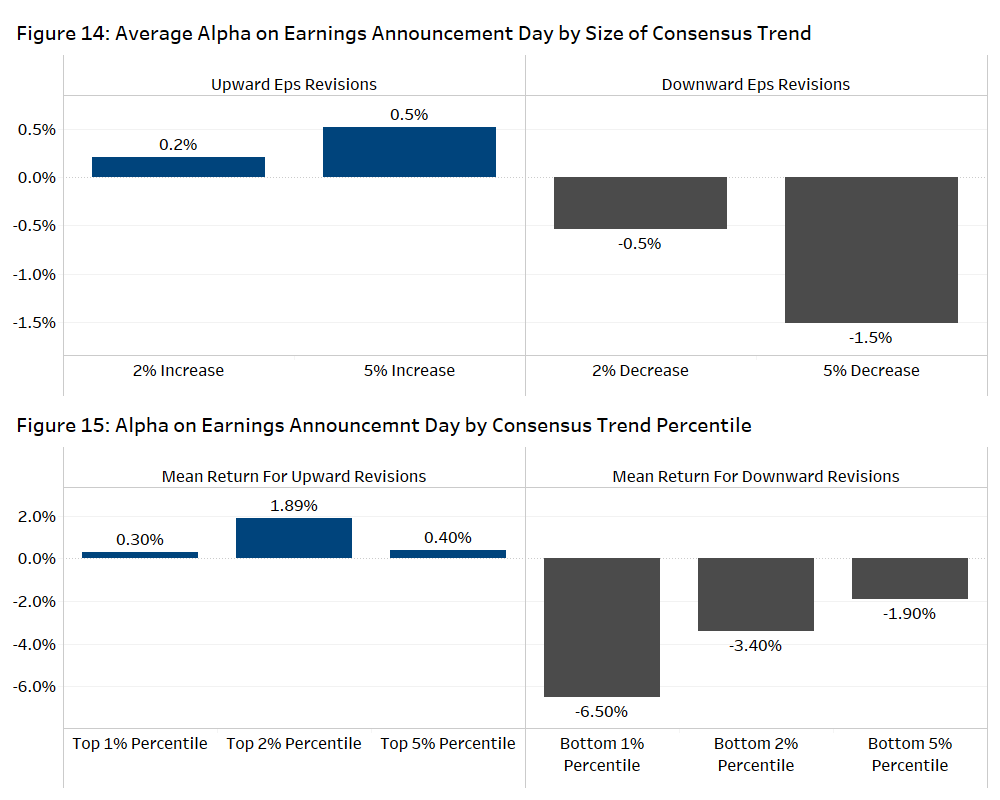
Risk Management
Managing Earnings Risk
The pre-earnings Estimize consensus trend is a strong signal, especially in identifying stocks likely to see extremely negative returns from the close prior to the report to the close after the report. The event study below shows over 200 basis points of residual return by going short stocks in the bottom five percentile (largest downward revisions) of pre-earnings consensus revisions.
The crowd-sourced data provided by Estimize not only provides compelling data for individual analysis, but also can provide greater insight into the market’s expectations. Whether used in isolation or alongside traditional consensus values, investors can gain an edge by tapping into the wisdom of the crowd. Recent studies by McKinley Capital Research and Wolfe Research highlight several ways investors can use Estimize in both pre-announcement and post-earnings drift strategies.
If you have any questions or would like to learn more about any of the content mentioned above, please contact us at sales@factset.com.
Please visit the product page on the Open:FactSet Marketplace for more information: Estimize U.S. Equities.
Works Cited
Guttman, Ilan, The Timing of Analysts' Earnings Forecasts (June 11, 2009). The Accounting Review, Vol. 85, 2010. Available at SSRN: https://ssrn.com/abstract=733905 or http://dx.doi.org/10.2139/ssrn.733905