Contents
The Basics
The Applications
The Coverage
The Differentiators
Example Use Case
FactSet’s ownership data provides institutional, mutual fund, stakeholder, insider transactions, and float-related share ownership information for equities and fixed income securities worldwide. Ownership data is collected using publicly available sources including regulatory filings and company websites. Descriptive and reference data is provided including institutional and fund categorizations enabling users to identify investment flows across holder types, sectors, and regions.
The Applications
Use Case
|
Description
|
|
Quantitative
|
Test ownership trends over time to identify signals
|
|
Application Development
|
Add ownership content to research portal/application
|
|
Sales and Marketing
|
Empower your sales team and populate your CRM with insights and prospect lists into holders of competitors' ETFs
|
The Coverage
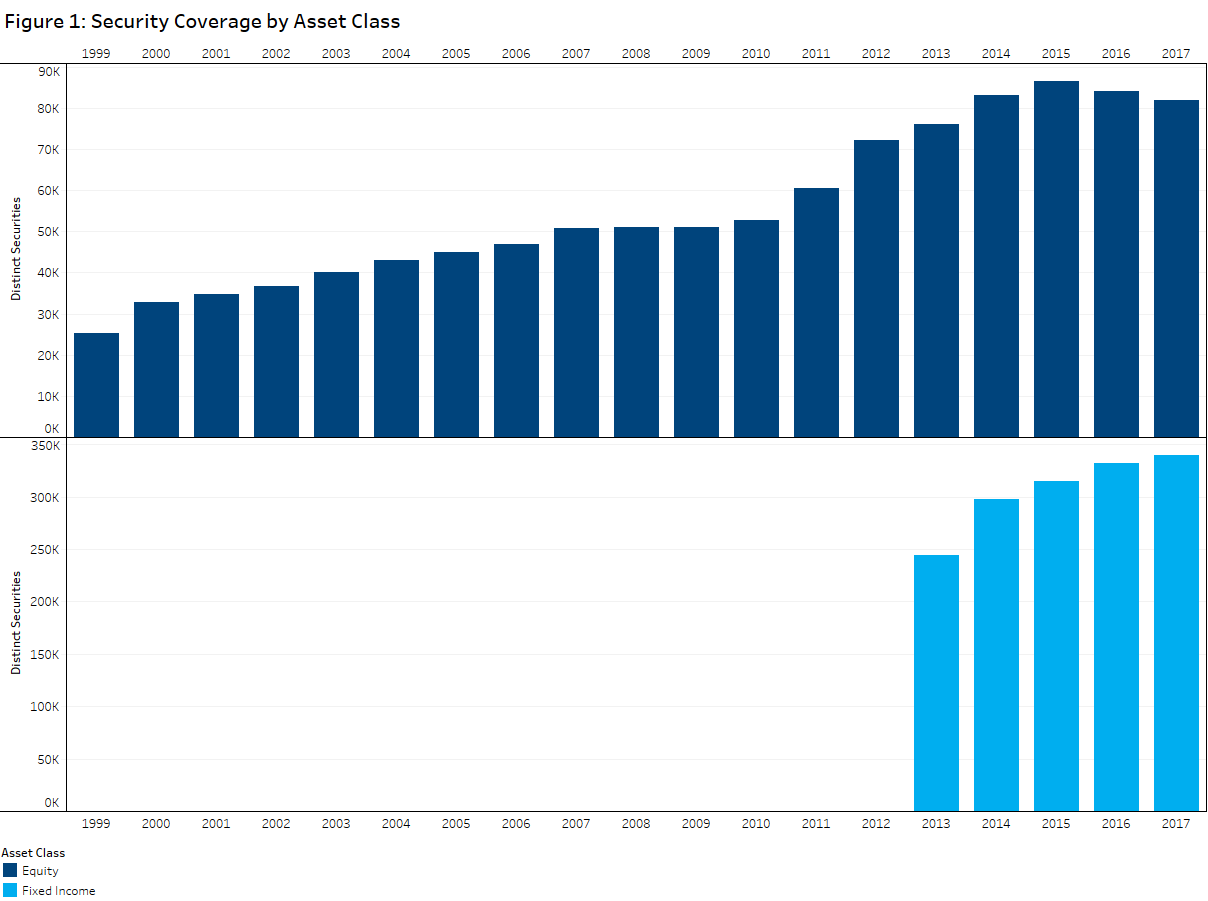
The FactSet Ownership database collects global equity ownership data for institutions, funds, and non-institutional “insider/stake holders”. History for equity securities is available back through 1999 and September 2013 for fixed income securities held within funds.
Institutional Ownership
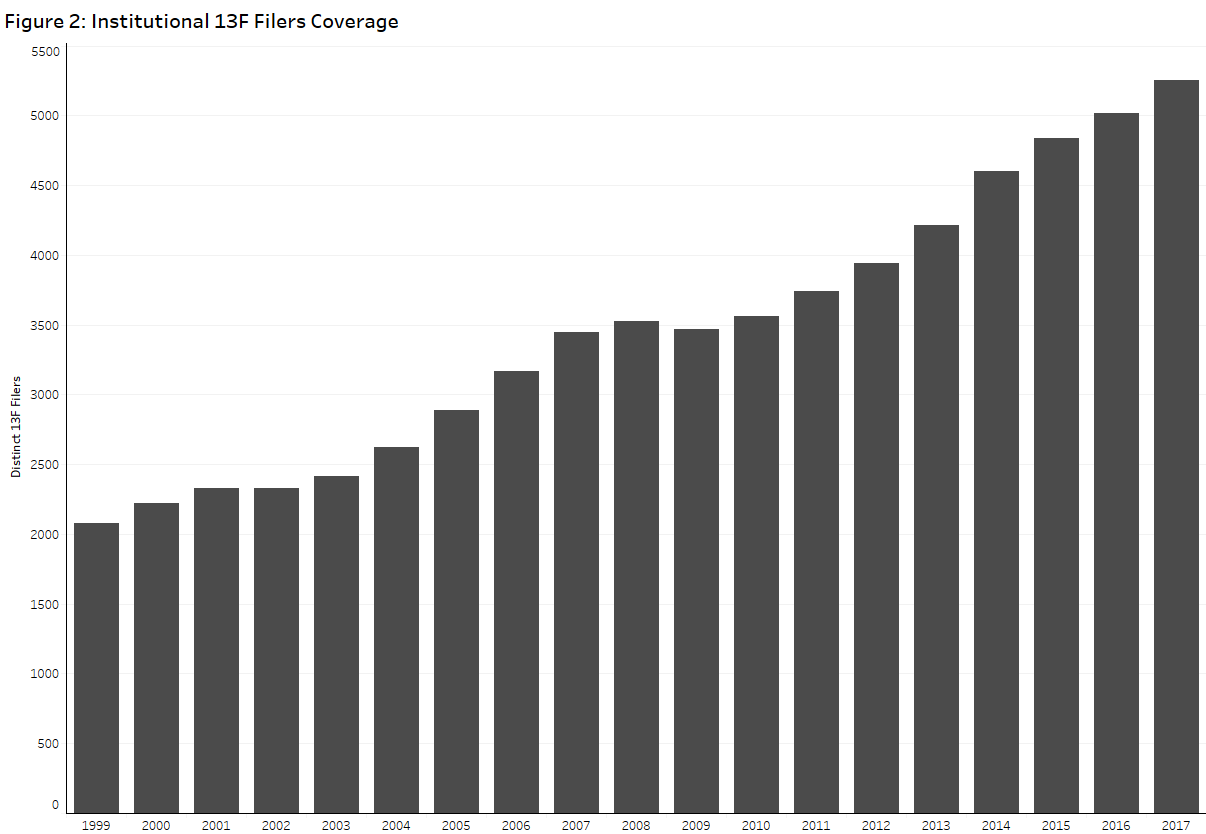
FactSet’s primary source for institutional ownership of U.S.- and Canadian-traded equities are quarterly 13F filings. For Non-North American equities, institutional ownership comes from stakes-based sources or from summing the positions of an institution’s underlying funds. Figure 2 below shows the number of 13F Filers FactSet has collected over time. In 2017 alone, FactSet collected equity ownership positions for 5,200+ 13F filers.
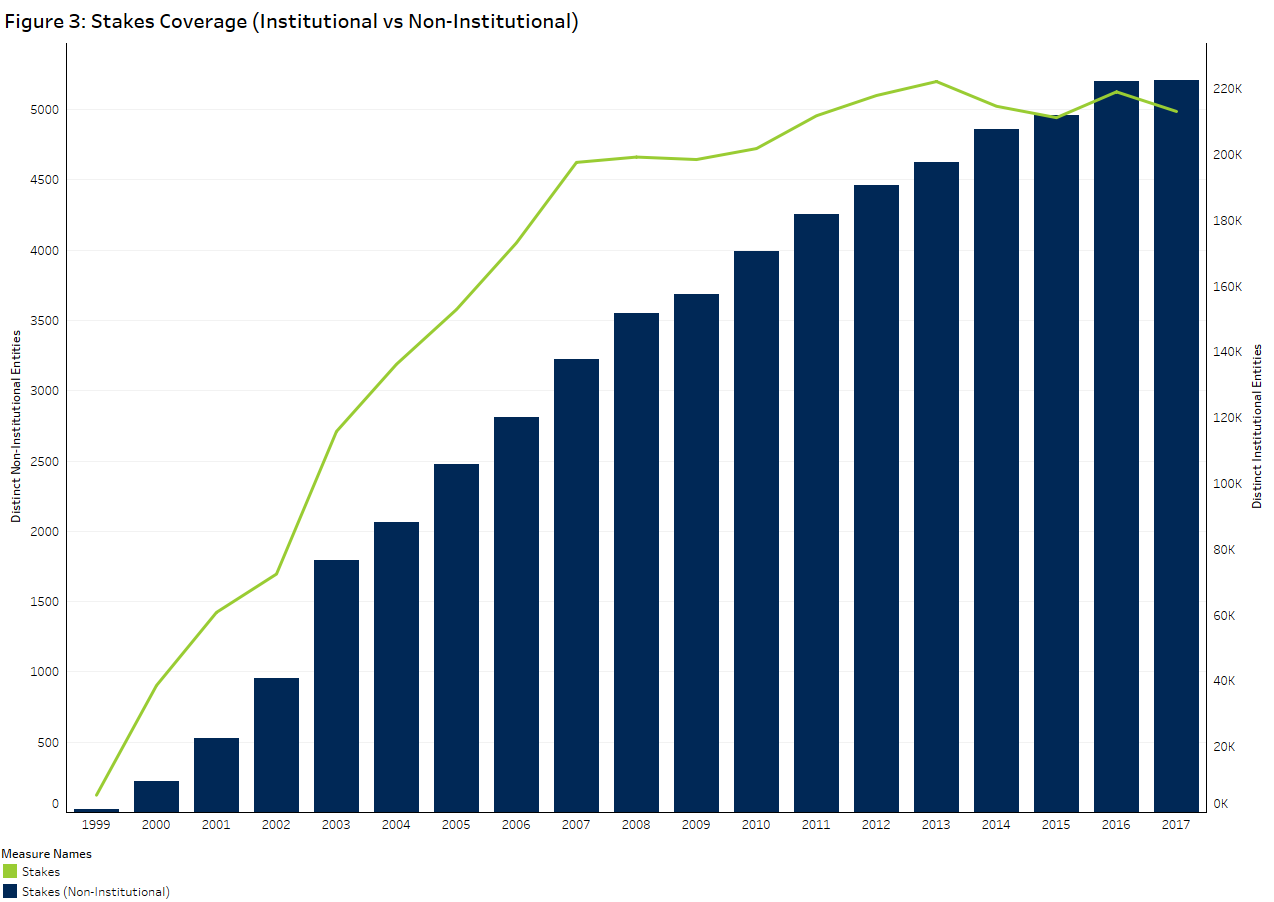
In addition to institutional ownership, FactSet offers global Stakes data for institutional/insider ownership with a comprehensive collection methodology tailored to a given region, country or exchange. For example, FactSet pursues semi-annual updates of the complete ownership provided for Japanese companies, while for the UK, information is sourced through analysis of the share register, S793 documents and RNS disclosures. More than 70 countries are covered daily and all legal disclosures of changes in ownership are documented. Figure 3 below shows the # of institutional investors and non-institutions FactSet has collected stakes-based positions for over time.
Fund Ownership
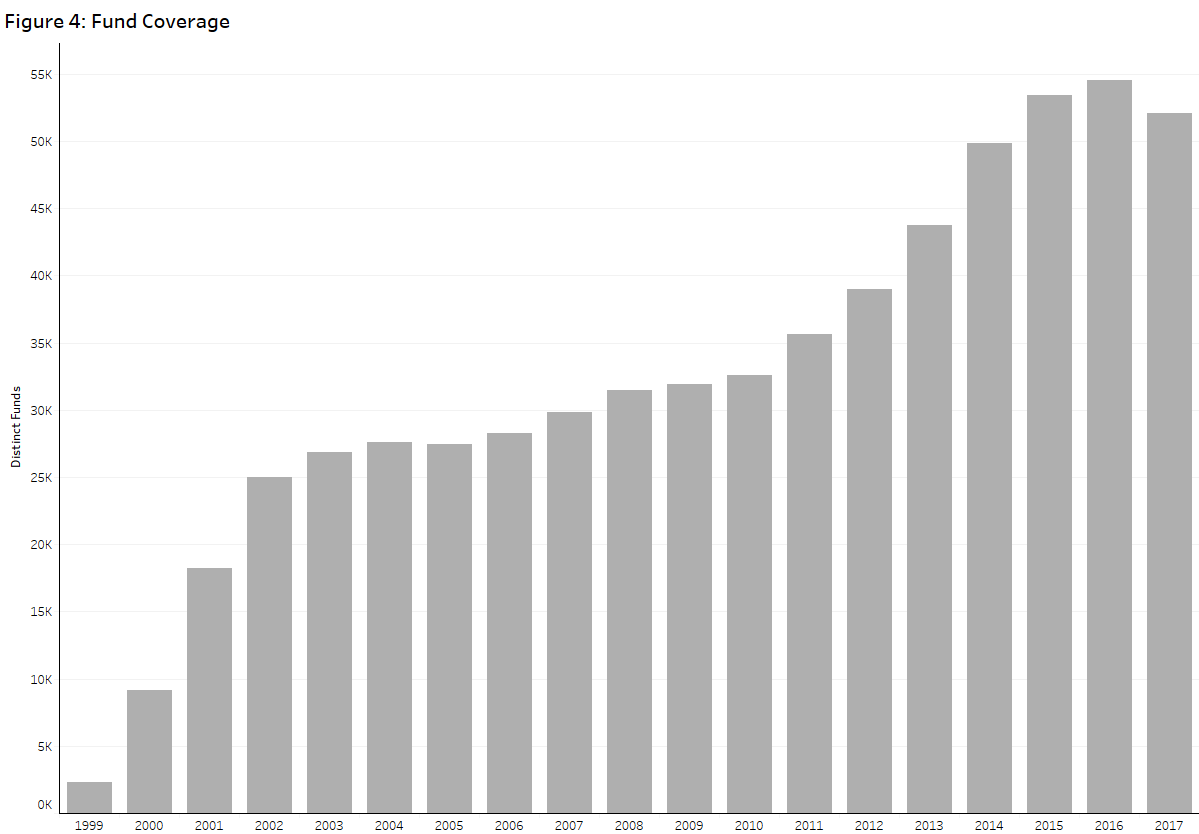
FactSet also deploys a hybrid collection model for Fund ownership. While regulatory requirements vary across the globe, FactSet aims to provide the lowest periodicity possible. For example, as of late 2004, U.S. mutual funds report quarterly via the SEC’s EDGAR system on forms N-Q, N-CSR, and occasionally form 485BPOS. However, most North America funds also make their fund portfolios available monthly on their websites. To ensure the most timely and accurate information is available, FactSet incorporates this monthly form of reporting in its collection process. Figure 4 below highlights the continued expansion in fund coverage. FactSet’s unique collection approach results in the majority of funds in North America, Europe, Pacific, and Latin America being collected on a monthly frequency.
The Differentiators
FactSet provides several date fields for 13F and fund positions that help users understand when the ownership information became publicly available. In addition to the report date and filing date, FactSet also provides a transfer date, which is the date that the filing was processed by FactSet. Users can leverage the transfer date when backtesting as a proxy for when the position would have been available in the dataset.
In today’s market, the true value of understanding the ownership profile of a company is integrating these insights alongside other attributes. FactSet’s entity centric symbology model enables users to easily connect ownership positions to additional content sets such as Fundamentals, Estimates, the Revere Taxonomy, and DMS Entity Reference content including Entity Structures.
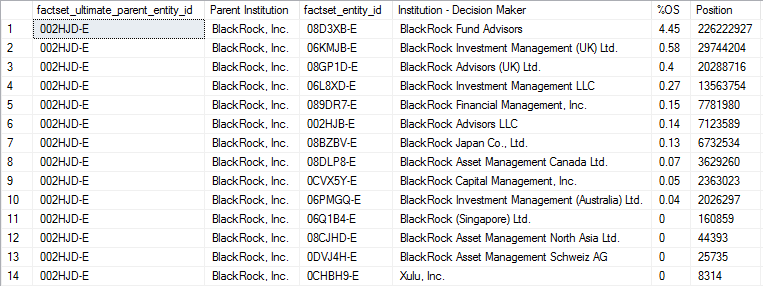
FactSet’s collection methodology and deep analysis of subsidiaries/parent companies’ links ownership positions to the true decision makers and minimizes data issues such as double-counting. This collection methodology enables users to view 13F positions at the decision maker level, or at the parent institution level when combining with FactSet’s DMS entity structure content. For example, Figure 6 below shows 13F filer positions in AAPL that roll up under the BlackRock, Inc., parent institution.
Figure 5: 13F Filer Positions in Apple
Example Use Case
A common use case for ownership content is to find investment trends that can provide signals for stock performance. Key to this analysis are institutional and fund categorizations such as type and style that enable users to easily group and filter positions. A hot topic in recent years has been the growth of passive investing and the impact this has on stock selection. Using FactSet’s ownership content, we can see this trend manifested in stock ownership over time.
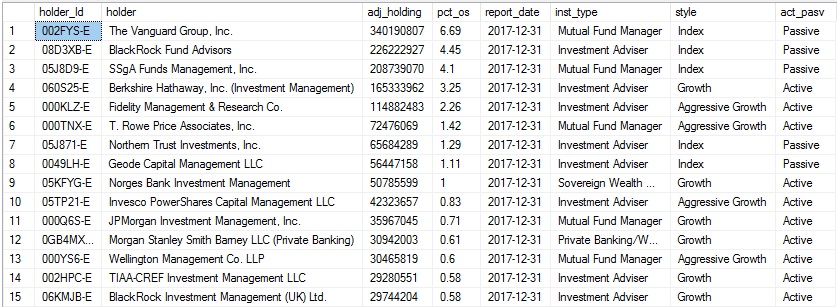
Using a query that returns 13F positions as of a historical date we can pull in the institutional holders of AAPL as of 12/31/2017 along with their Style categorization (query found in Appendix A). In figure 7 below we are leveraging this categorization field to flag Passive investors as those where Style is equal to Index.
Figure 6: Investment Style for Holders of Apple
By grouping on this flag, aggregating positions over a broad market index, and iterating over time we can view historical trends in institutional passive ownership. Let’s look at this for large cap stocks vs small caps in the Russell 3000. For this example, Python was used with FactSet’s OnDemand web service to iterate a query for aggregated active/passive ownership in index constituents over time (SQL query found in Appendix A). Figure 8 below shows the growth in passive ownership for the Russell Top 200 vs the Russell 2000.
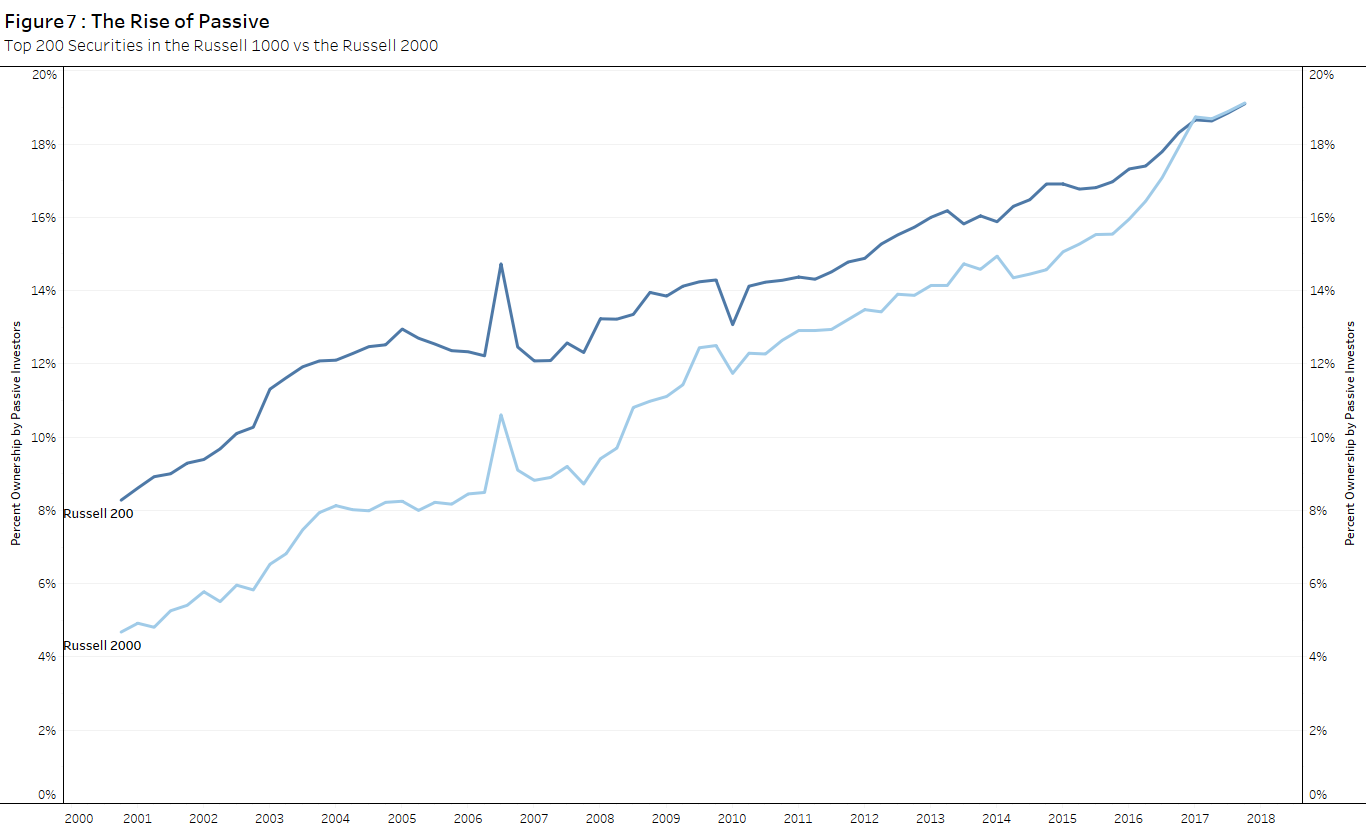
As we can see, passive ownership has risen steadily for both groups over time and both show very similar passive ownership currently. However, back in the early 2000’s, passive ownership is significantly higher for large cap stocks compared to small caps. One explanation for this is the recent rise in specialized ETFs that focus on specific market segments in contrast to the early 2000’s when ETFs were largely based on cap-weighted indices. Performing deeper analysis into the traits exhibited by stocks with high passive ownership can give investors insights into the impacts this can have on future stock performance.
It is crucial for investors in today’s market to understand the ownership profile of stocks and how this can affect future performance. FactSet Ownership’s strong coverage, collection methodology, symbology stitching, investor categorizations, and descriptive data empowers users to analyze investment trends and incorporate this knowledge into their investment process.
If you have any questions or would like to learn more about any of the content mentioned above, please contact us at sales@factset.com.
Please visit the product page on the Open:FactSet Marketplace for more information: FactSet Ownership.
Appendix A: Code
SQL Query for 13f positions with active/passive flag
--QUERYING FOR 13F POSITIONS IN A SECURITY AND FLAGGING INSTITUTIONS AS ACTIVE/PASSIVE BASED ON STYLE
DECLARE @PRICEDATE DATE
DECLARE @HISTDATE DATE
DECLARE @DAYSBACK INTEGER
DECLARE @DAYSAHEAD INTEGER
SET @HISTDATE = '2017-12-31' --AS OF DATE
SET @DAYSBACK = -730 --NUMBER OF DAYS PRIOR TO THE @HISTDATE THAT THE HOLDINGS WOULD BE CONSIDERED VALID
SET @DAYSAHEAD = 0 --NUMBER OF DAYS AFTER THE @HISTDATE THAT THE HOLDINGS WOULD BE CONDIDERED VALID
SET @PRICEDATE = (SELECT MAX(PRICE_DATE) FROM OWN_V5.OWN_SEC_PRICES WHERE PRICE_DATE BETWEEN DATEADD(DD,@DAYSBACK,@HISTDATE) AND DATEADD(DD,@DAYSAHEAD,@HISTDATE))
SELECT CI.FACTSET_ROLLUP_ENTITY_ID HOLDER_ID --ROLLUP ENTITY IS THE AGGREGATE MANAGING INSTITUTION FOR THE 13F FILER, FACTSET USERS CAN CHOOSE WHETHER TO VIEW POSITIONS AT THIS OR THE MORE GRANULAR FILER LEVEL
,EP.ENTITY_PROPER_NAME HOLDER
,SUM(H.ADJ_HOLDING) ADJ_HOLDING
,ROUND(SUM(H.ADJ_HOLDING / P.ADJ_SHARES_OUTSTANDING) * 100,2) PCT_OS
,MAX(H.REPORT_DATE) REPORT_DATE
,M.ENTITY_SUB_TYPE_DESC INST_TYPE
,I.STYLE
,'ACT_PASV' =
CASE
WHEN STYLE = 'INDEX'
THEN 'PASSIVE'
WHEN STYLE IS NULL
THEN 'OTHER'
ELSE 'ACTIVE'
END
FROM OWN_V5.OWN_INST_13F_DETAIL H
JOIN OWN_V5.OWN_ENT_13F_COMBINED_INST CI ON CI.FACTSET_FILER_ENTITY_ID = H.FACTSET_ENTITY_ID
JOIN SYM_V1.SYM_ENTITY EP ON EP.FACTSET_ENTITY_ID = CI.FACTSET_ROLLUP_ENTITY_ID
JOIN --SELECT THE LATEST REPORT DATE FOR 13F FILERS WITHIN THE WINDOW
(
SELECT CI.FACTSET_ROLLUP_ENTITY_ID
,MAX(FH.REPORT_DATE) AS MAX_DATE
FROM OWN_V5.OWN_ENT_13F_FILING_HIST FH
JOIN OWN_V5.OWN_ENT_13F_COMBINED_INST CI ON CI.FACTSET_FILER_ENTITY_ID = FH.FACTSET_13F_FILER_ENTITY_ID
WHERE FH.REPORT_DATE BETWEEN DATEADD(DD,@DAYSBACK,@HISTDATE) AND DATEADD(DD,@DAYSAHEAD,@HISTDATE)
GROUP BY CI.FACTSET_ROLLUP_ENTITY_ID
) MD ON MD.MAX_DATE = H.REPORT_DATE AND MD.FACTSET_ROLLUP_ENTITY_ID = CI.FACTSET_ROLLUP_ENTITY_ID
JOIN OWN_V5.OWN_SEC_PRICES P ON P.FSYM_ID = H.FSYM_ID AND P.PRICE_DATE = @PRICEDATE
LEFT JOIN OWN_V5.OWN_ENT_INSTITUTIONS I ON I.FACTSET_ENTITY_ID = CI.FACTSET_ROLLUP_ENTITY_ID
LEFT JOIN REF_V2.ENTITY_SUB_TYPE_MAP M ON M.ENTITY_SUB_TYPE_CODE = I.ENTITY_SUB_TYPE --ENTITY_SUB_TYPE FIELD CONTAINS THE INSTITUTION TYPE
WHERE H.FSYM_ID IN ('R85KLC-S')
GROUP BY CI.FACTSET_ROLLUP_ENTITY_ID,EP.ENTITY_PROPER_NAME,M.ENTITY_SUB_TYPE_DESC,I.STYLE
ORDER BY PCT_OS DESC
|
SQL Query for aggregated active/passive positions passing in universe
DECLARE @PRICEDATE DATE
DECLARE @HISTDATE DATE
DECLARE @DAYSBACK INTEGER
DECLARE @DAYSAHEAD INTEGER
SET @HISTDATE = '%S' --AS OF DATE
SET @DAYSBACK = -730 --NUMBER OF DAYS PRIOR TO THE @HISTDATE THAT THE HOLDINGS WOULD BE CONSIDERED VALID
SET @DAYSAHEAD = 0 --NUMBER OF DAYS AFTER THE @HISTDATE THAT THE HOLDINGS WOULD BE CONDIDERED VALID
SET @PRICEDATE = (SELECT MAX(PRICE_DATE) FROM OWN_V5.OWN_SEC_PRICES WHERE PRICE_DATE BETWEEN DATEADD(DD,@DAYSBACK,@HISTDATE) AND DATEADD(DD,@DAYSAHEAD,@HISTDATE))
SELECT @HISTDATE
,ACT_PASV
,SUM(ADJ_HOLDING) TOTAL_HOLDING
,ROUND(SUM(A.ADJ_HOLDING) /
(
SELECT SUM(P.ADJ_SHARES_OUTSTANDING)
FROM OWN_V5.OWN_SEC_PRICES P
WHERE FSYM_ID IN (%S) AND P.PRICE_DATE = @PRICEDATE
) * 100,2) PCT_OS
FROM
(
SELECT H.FSYM_ID
,CI.FACTSET_ROLLUP_ENTITY_ID
,SUM(H.ADJ_HOLDING) ADJ_HOLDING
,MAX(H.REPORT_DATE) REPORT_DATE
, 'ACT_PASV' =
CASE
WHEN STYLE = 'INDEX'
THEN 'PASSIVE'
WHEN STYLE IS NULL
THEN 'OTHER'
ELSE 'ACTIVE'
END
FROM OWN_V5.OWN_INST_13F_DETAIL H
JOIN OWN_V5.OWN_ENT_13F_COMBINED_INST CI ON CI.FACTSET_FILER_ENTITY_ID = H.FACTSET_ENTITY_ID
JOIN --SELECT THE LATEST REPORT DATE FOR 13F FILERS WITHIN THE WINDOW
(
SELECT CI.FACTSET_ROLLUP_ENTITY_ID
,MAX(FH.REPORT_DATE) AS MAX_DATE
FROM OWN_V5.OWN_ENT_13F_FILING_HIST FH
JOIN OWN_V5.OWN_ENT_13F_COMBINED_INST CI ON CI.FACTSET_FILER_ENTITY_ID = FH.FACTSET_13F_FILER_ENTITY_ID
WHERE FH.REPORT_DATE BETWEEN DATEADD(DD,@DAYSBACK,@HISTDATE) AND DATEADD(DD,@DAYSAHEAD,@HISTDATE)
GROUP BY CI.FACTSET_ROLLUP_ENTITY_ID
) MD ON MD.MAX_DATE = H.REPORT_DATE AND MD.FACTSET_ROLLUP_ENTITY_ID = CI.FACTSET_ROLLUP_ENTITY_ID
LEFT JOIN OWN_V5.OWN_ENT_INSTITUTIONS I ON I.FACTSET_ENTITY_ID = CI.FACTSET_ROLLUP_ENTITY_ID
WHERE H.FSYM_ID IN (%S)
GROUP BY H.FSYM_ID, CI.FACTSET_ROLLUP_ENTITY_ID, STYLE
) A
GROUP BY ACT_PASV
|
