Contents
The Basics
The Applications
The Coverage
The Differentiators
Example Use Case
The Basics
Genscape is the leading global provider of real-time data and intelligence for commodity and energy markets. The company’s mission is to improve market transparency and efficiency, and it delivers innovative solutions across a number of asset classes including Oil, Power, Natural Gas and LNG (natural and liquefied natural gas), Agriculture, Petrochemical and NGLs, Maritime, and Renewables. Market fundamentals are measured using thousands of patented and proprietary land, sea, and satellite monitors that are strategically deployed worldwide, providing exceptional insight and intelligence to clients.
Using Genscape's patented analytics, the Equity Production Insight Data Feed provides the daily production estimates of Energy and Power companies for their respective regions, as well as the tailgate processing plant volume or throughput volumes for midstream companies.
The Applications
Use Case
|
Description
|
|
Fundamental Analysis
|
Introduce pre-announcement data into fundamental models
|
|
Quantitative Research
|
New source of alpha for quantitative investment models
|
|
Portfolio Management
|
Use as a timing tool to speed up or delay trades
|
The Coverage
The Equity Production Insight Data Feed provides estimates for 30 producer and 21 midstream companies as of March 2018, with new companies added on a regular basis. The feed includes:
- Historical estimates as early as January 2011 (see Figure 1)
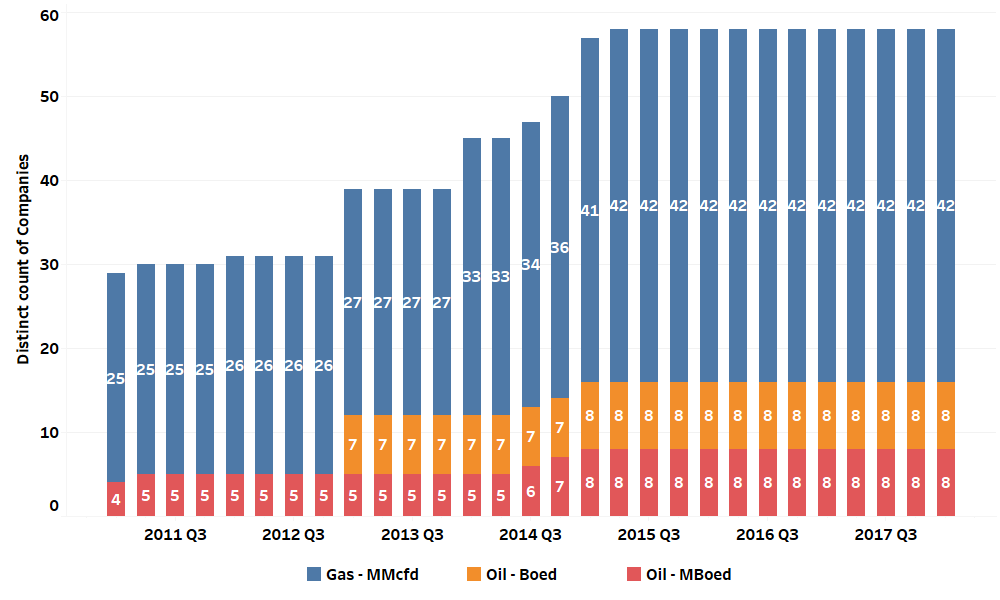
- Gas and oil production coverage (see Figure 2)
- Updates published weekly, with the data frequency being daily for all estimates
Figure 1 – Producer and Midstream Company Coverage
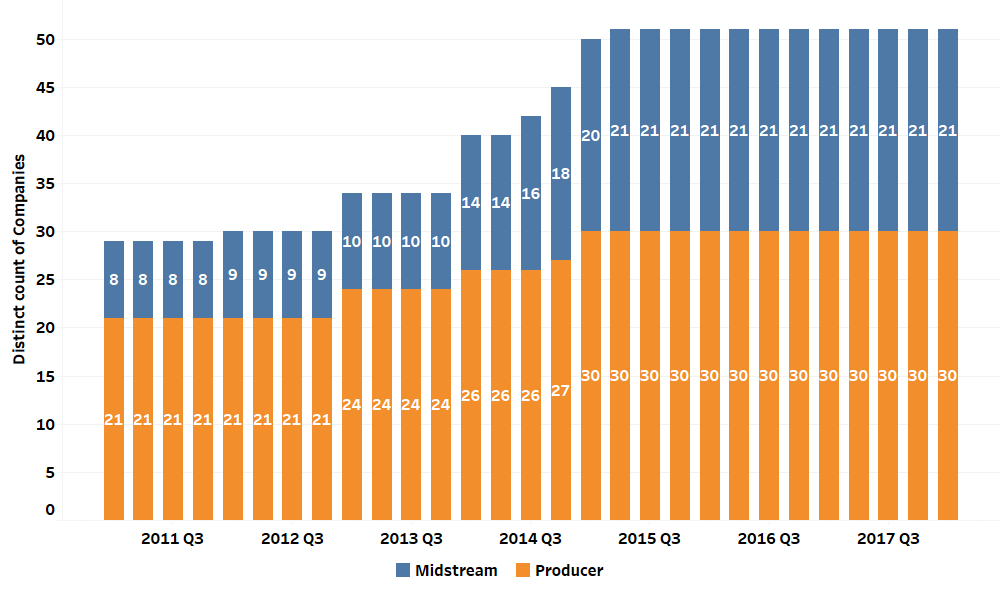
Figure 2 – Company Coverage by Commodity
The Differentiators
The Genscape-modeled production estimates are tuned to have a strong correlation to the actual company-reported net production numbers, with each subsequent quarter being out of sample.
Genscape has demonstrated a <5% error rate in forecasting production since 2013, providing confidence and actionable insights to clients. Its Equity Production Insight Data Feed is the only product that can provide this data, using Genscape's proprietary oil pipeline and rail terminal monitoring to track operator-level oil production in the Bakken.
Genscape’s Equity Production Insight Data Feed allows you to:
- Gain clarity into an individual company’s oil and gas production at play level on a weekly basis to understand the impact on quarterly earnings and production levels
- Inform investment decisions and risk/reward calculations with granular data and analysis for E&P companies
- Gain insight into daily oil and gas production at the producer level to inform portfolio management strategies
Example Use Case
Genscape’s unique data provides a method to accurately forecast changes in oil and gas production levels, delivering insight to clients before official quarterly report. Figure 3 shows this scenario for Oasis Petroleum, highlighting the accuracy of Genscape’s production estimates. This figure shows a very low error rate in production forecasting for Oasis Petroleum.
Figure 3: Oasis Petroleum – Natural Gas Production Volume vs. Genscape EPI Estimates
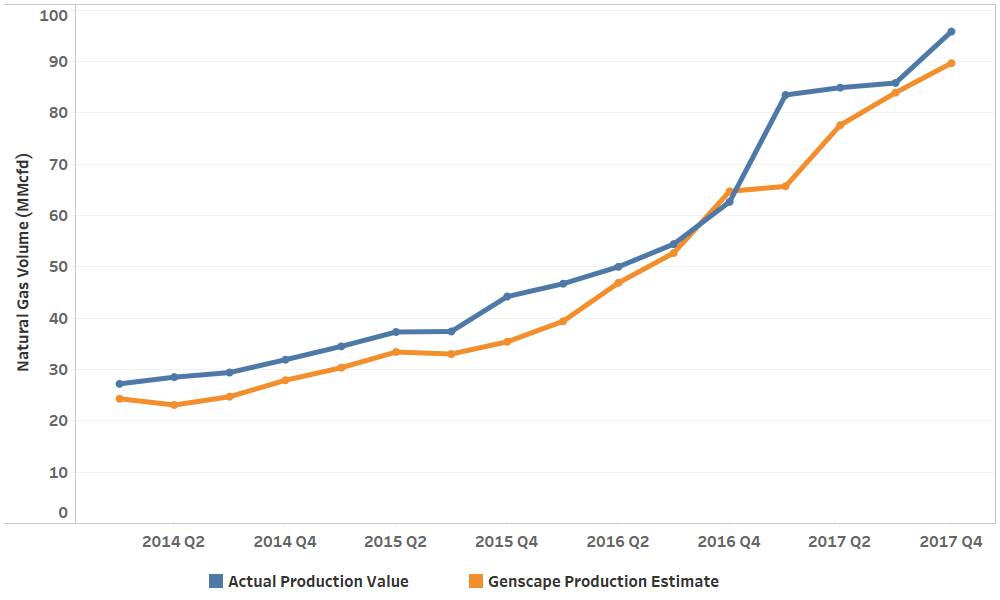
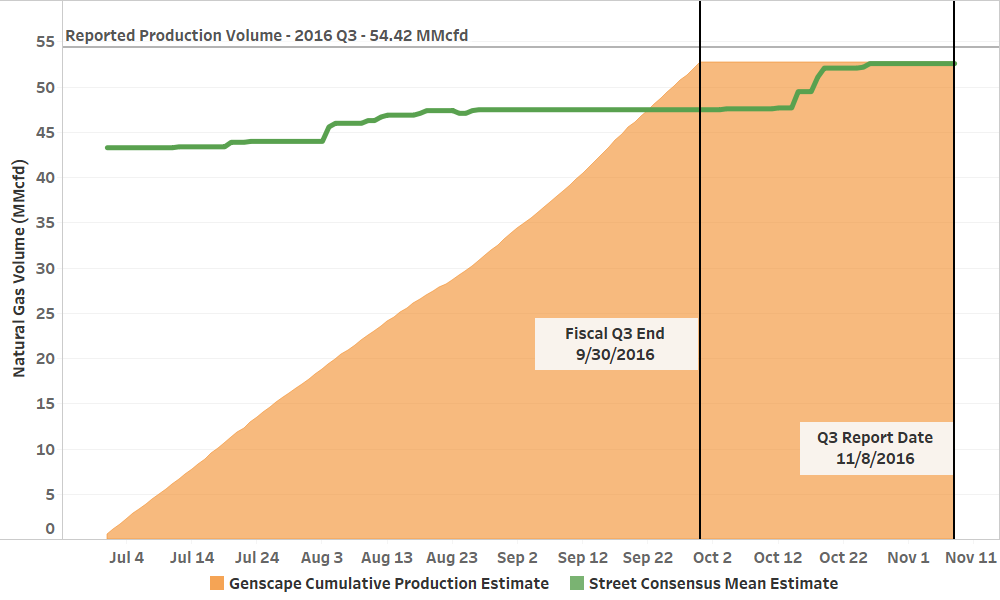
Figure 4 highlights a more specific scenario for Oasis Petroleum in 2016 Q3. You can see the cumulative daily production estimates from Genscape hit a final value of 52.69 at the quarter end date of September 30, 2016. Due to Genscape’s forecasting accuracy, users of this data gain insight into final production capacity weeks before the quarterly report date of November 8, 2016. Users can also compare and complement this data to the production consensus delivered by FactSet Estimates, providing additional opportunities to find value.
Figure 4: Oasis Petroleum - 2016 Q3 Results

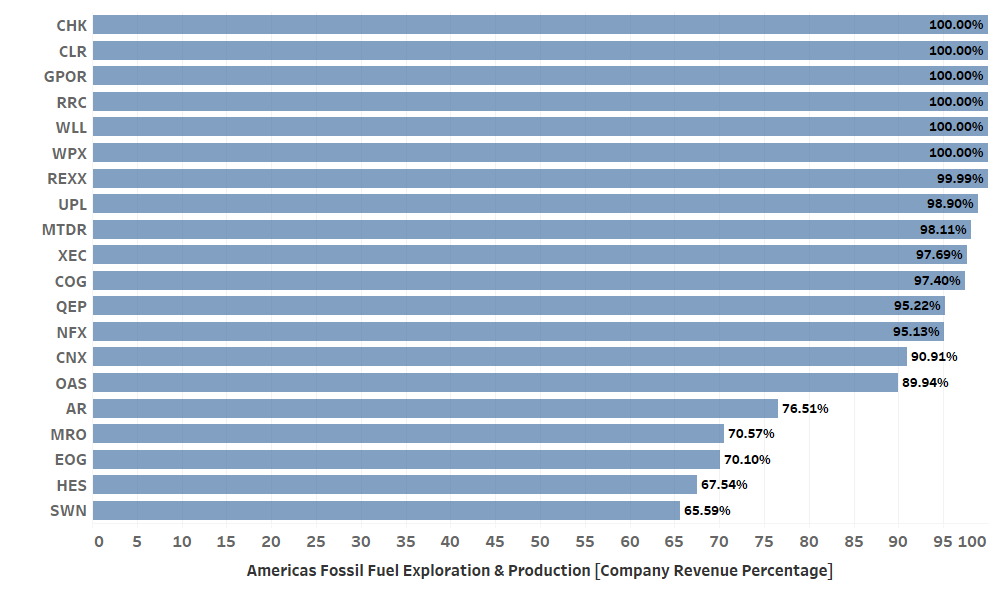
With production closely tied to a company’s revenue, portfolio managers can benefit from these production estimates weeks in advance of a company’s earnings being released. This is even more critical to understand when companies have a large percentage of their revenues tied to a specific region/industry combination. Figure 5 illustrates this by highlighting the top 20 companies with revenues linked to Americas Fossil Fuel Exploration & Production category, as defined by the FactSet RBICS with Revenue Data Feed. Oasis Petroleum specifically derives over 89% of its revenue from this category, further highlighting the importance of understanding its production capacity.
Figure 5: Revenue Exposure by RBICs Sector
Whether you are interested in potential production shifts or doing historical analysis, Genscape’s Equity Production Insight Data Feed will help you monitor trends and estimate quarterly production.
If you have any questions or would like to learn more about any of the content mentioned above, please contact us at sales@factset.com.
Please visit the product page on the Open:FactSet Marketplace for more information: Genscape's Equity Production Insights.