Basics
Content Category: Intellectual Property
Open:FactSet Page: Click here
Setup a Demo and Access Today: sales@factset.com
Founded in 2018, the Quant IP team extracts value from the information buried in more than 130 million patent documents. Quant IP leverages deep experience in patent law, statistical expertise, and smart algorithms as well as AI-powered software to gain insights from both patent data and financial metrics.
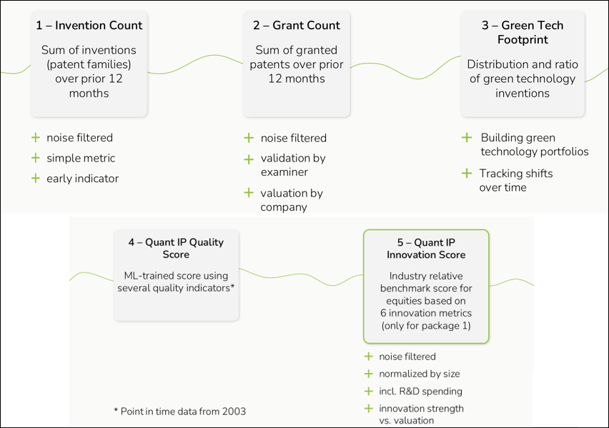
Quant IP evaluates the quality of the innovation process for thousands of companies worldwide and reveals their true innovation power in one simple indicator: The Quant IP Innovation Score. This aggregated indicator for consistency, quality, and efficiency of a company's innovation process makes it possible to rank listed companies according to their innovation power and build portfolios to outperform regular equity indices.
In addition, Quant IP offers various innovation metrics from patent applications to specific quality indicators on company level. All data is point-in-time and suitable for rigorous back testing. The raw patent data is derived in aggregated form with a high level of quality and is updated frequently.
Quant IP offers three packages that can be ordered separately or available as one overarching comprehensive standard data feed, inclusive of all three below:
- Package 1 targets investors in public markets and covers listed companies with a minimum market cap of 1B USD from developed markets, namely North America, Europe, and Japan starting in 1995. Patent metrics are provided alongside an innovation score and updated monthly.
- Package 2 targets investors in public markets and covers listed companies with market cap less than 1B USD from developed markets, namely U.S., Europe, and Japan starting in 1995. Patent metrics are provided alongside an innovation score and updated monthly.
- Package 3 targets investors in emerging markets and covers listed companies from relevant emerging markets (i.e., namely Korea, Taiwan, and Chinese provinces) starting in 1995. Patent metrics are provided alongside an innovation score and updated monthly.
Data Overview
Asset Class: Public Companies
Data Frequency: Monthly
Delivery Frequency: Monthly
History: Data available back to 1995
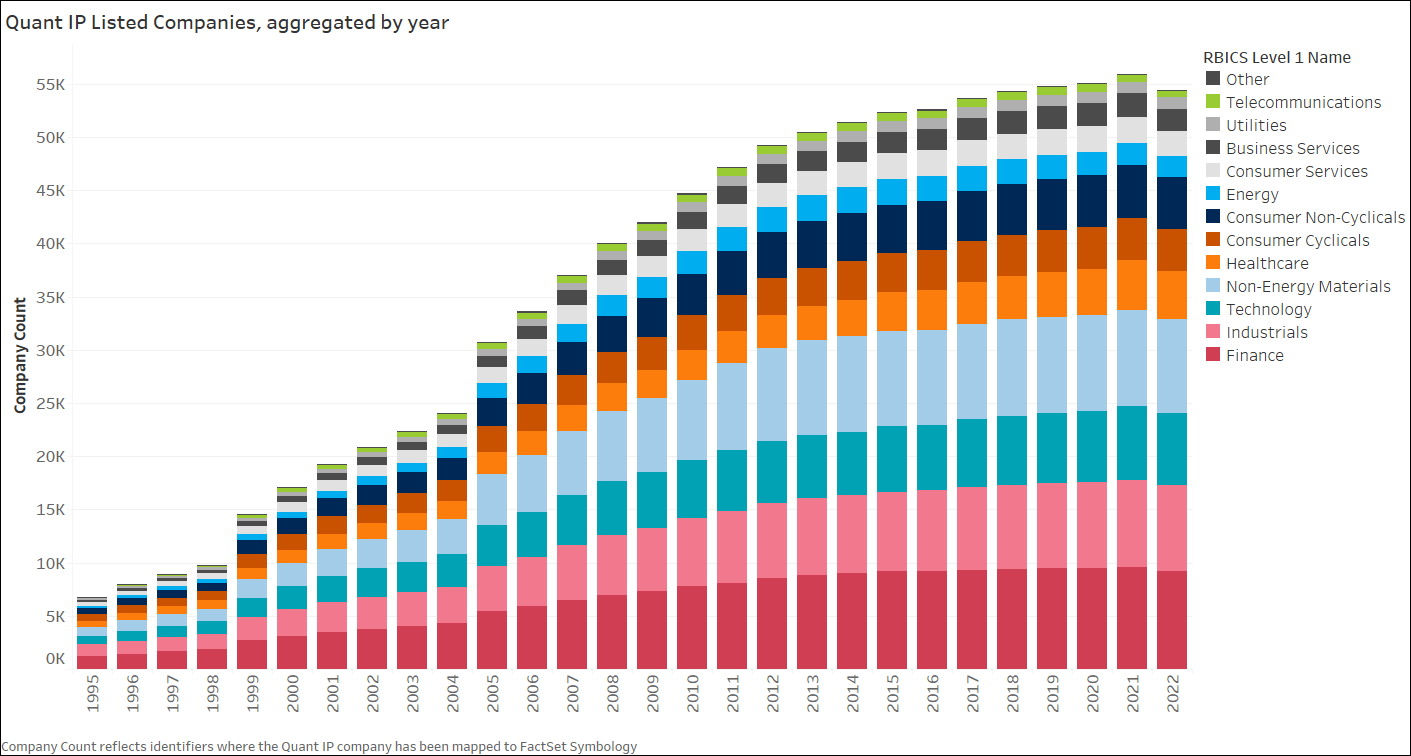
The following chart illustrates the Quant IP coverage breakdown using FactSet's Revere Business Industry Classification L1 Names throughout time.
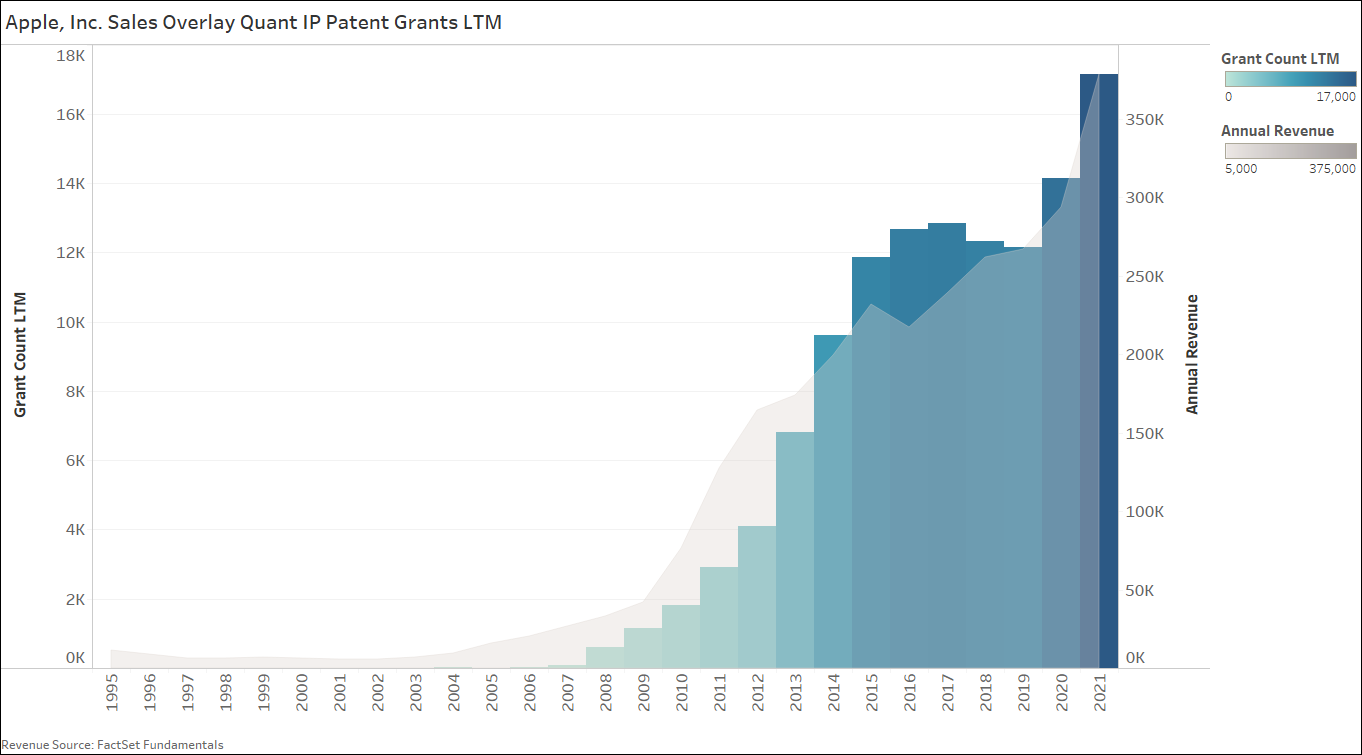
Quant IP’s dataset can be leveraged with numerous other content sets including but not limited to FactSet Fundamentals. In the below graph, we highlight Apple’s annualized sales alongside their last 12-month Patent Grant count throughout time. A probable correlation between Apple’s emphasis on innovations and their revenue stream is ramping up considerably in the late 2000s into the 2010s.

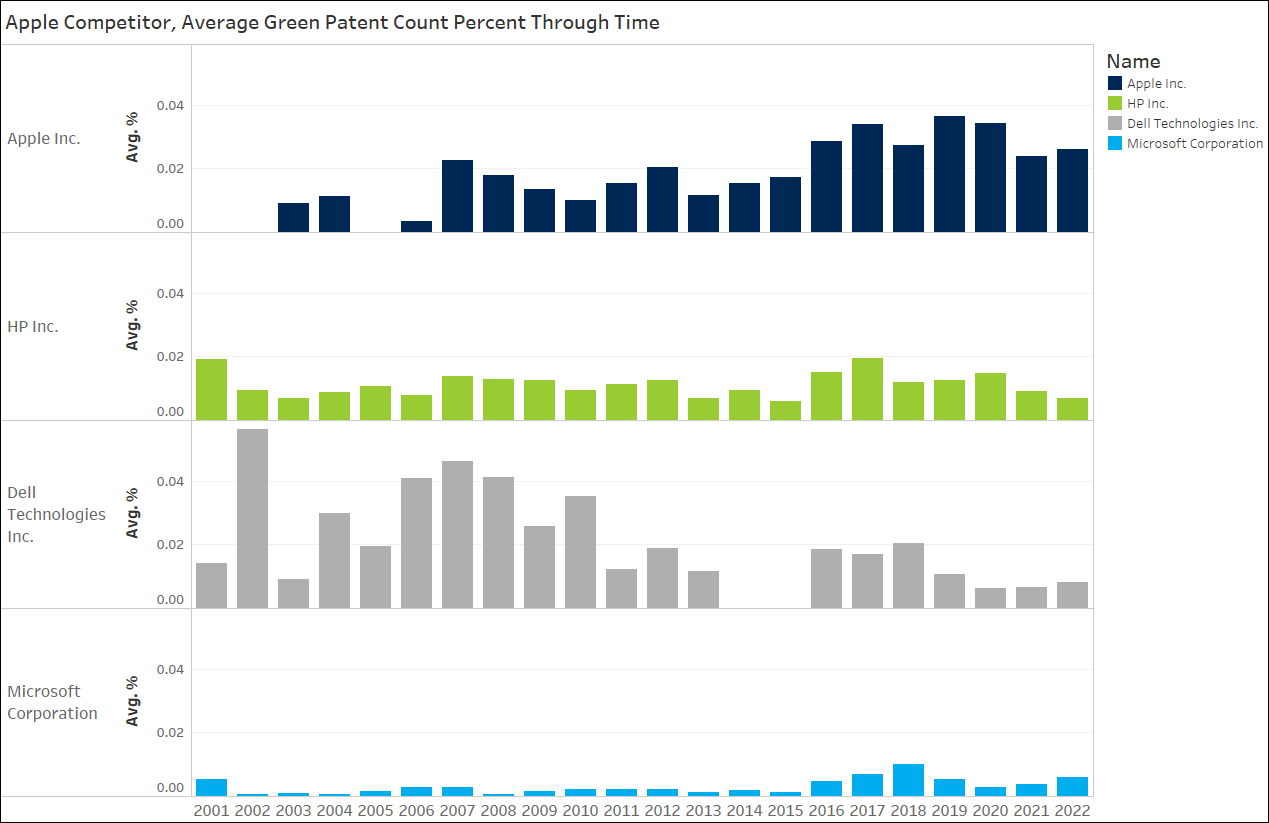
To take things a step further, we can use Quant IP’s dataset to gain some insight into the company’s emphasis on green patents. Below, we showcase the distribution percentage of green patents relative to the company’s overall innovations throughout time. We have also juxtaposed some of Apple’s competitors that are covered by Quant IP.
The chart suggests that Apple initiated its emphasis on green innovations around Q1 of 2006. Dell, however, had been an early forerunner in the green innovation space relative to its competitors in the early 2000s but has since faded. It’s worth noting that for coverage start date parity in this illustration, we’ve removed dates preceding 2001.
Furthermore, the connectedness of this content can facilitate logical joins to a range of ESG offerings to further uncover signals.

Data Methodology
Patent data is derived from IFI Claims, a high-quality aggregator of raw patent data from 40+ patent offices around the world. This comprehensive network allows for frequent updates and robust language translations that serve as the foundation of Quant IP´s datasets.
Fundamental data and corporate trees—both important for calculating the Quant IP Innovation Score—are derived from Standard and Poor’s Capital IQ’s raw data. Historical data is point-in-time, assigning the patent data from subsidiaries to main entities with very high precision.
All processing of data is rule based without human judgement; Quant IP applies sanity and quality checks at various points during the data processing process.
Use Cases
Alpha Generation
- Quant IP allows clients to uncover companies with strong innovation power, which leads to business success, high profitability, and typically reflects management with long-term viewpoints. Today’s innovations are tomorrow’s products, sales, and profits. Patents represent a legal monopoly that also allow for higher prices. A sustainable patent strategy means short-term cost and long-term competitive advantage.
Benchmarking
- The quality indicators make it possible to benchmark the patent portfolios of thousands of companies. Point-in-time data makes it possible to benchmark over time and detect significant changes.
Stock Picking
- Patent and innovation metrics are suited well for stock selection. Point-in-time data starting in 1995 makes it possible to backtest strategies based on filing activity, patent grants, quality indicators, or the Quant IP Innovation Score. Several backtests show significant risk-adjusted outperformance for strategies for many industries and markets.
The details provided above are as of April 2022.
If you have any questions or would like to learn more about any of the content mentioned above, please contact us at sales@factset.com.
Please visit the product page on the Open:FactSet Marketplace for more information: Quant IP Patent and Innovation Metrics.