The Basics
Woodseer is a technology firm that provides more accurate dividend forecast data and analytics to financial professionals around the world. The company focuses on scale and automation to offer expanding coverage on 7,900+ companies (to date) by combining algorithmic calculations with input from a London-based analyst team to ensure every new forecast increases long term accuracy.
The product information and content statistics contained in this document are as of June 2018.
The Applications
Use Case
|
Description
|
|
Fundamental Analysis
|
Augment existing fundamental analysis with estimates for future dividend dates and amounts
|
|
Discretionary Managers
|
Create screens for any given sector to identify anomalies between companies within it
|
|
Quantitative Research
|
Uncover new source of alpha for quantitative investment models
|
The Coverage
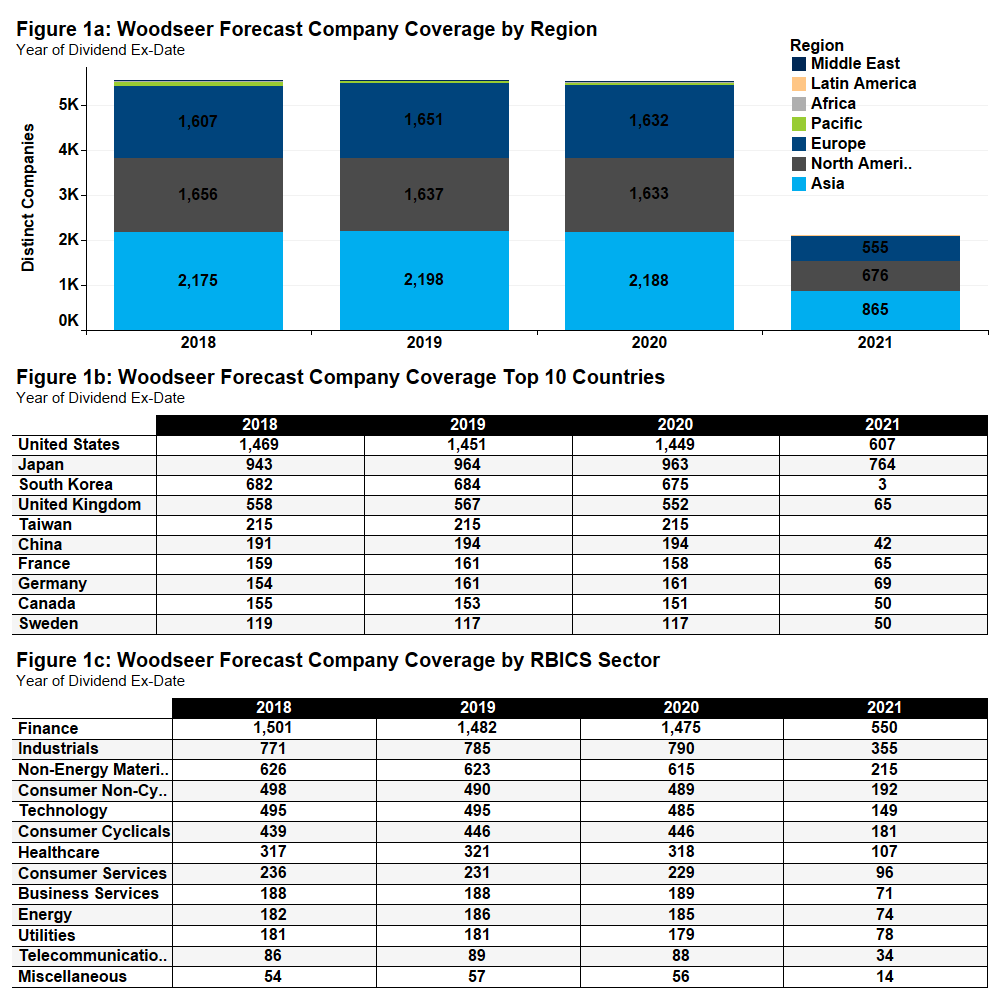
The Woodseer Dividend Forecast DataFeed covers a global universe of over 7,900 companies that span developed and emerging markets. The universe is inclusive of firms with active dividends and those monitored for future changes with dividend date and amount forecasts available beginning in January 2017. Forecasts cover a forward looking 24 months. Figure 1 highlights the yearly company forecast coverage by region, top 10 countries, and RBICS sector.
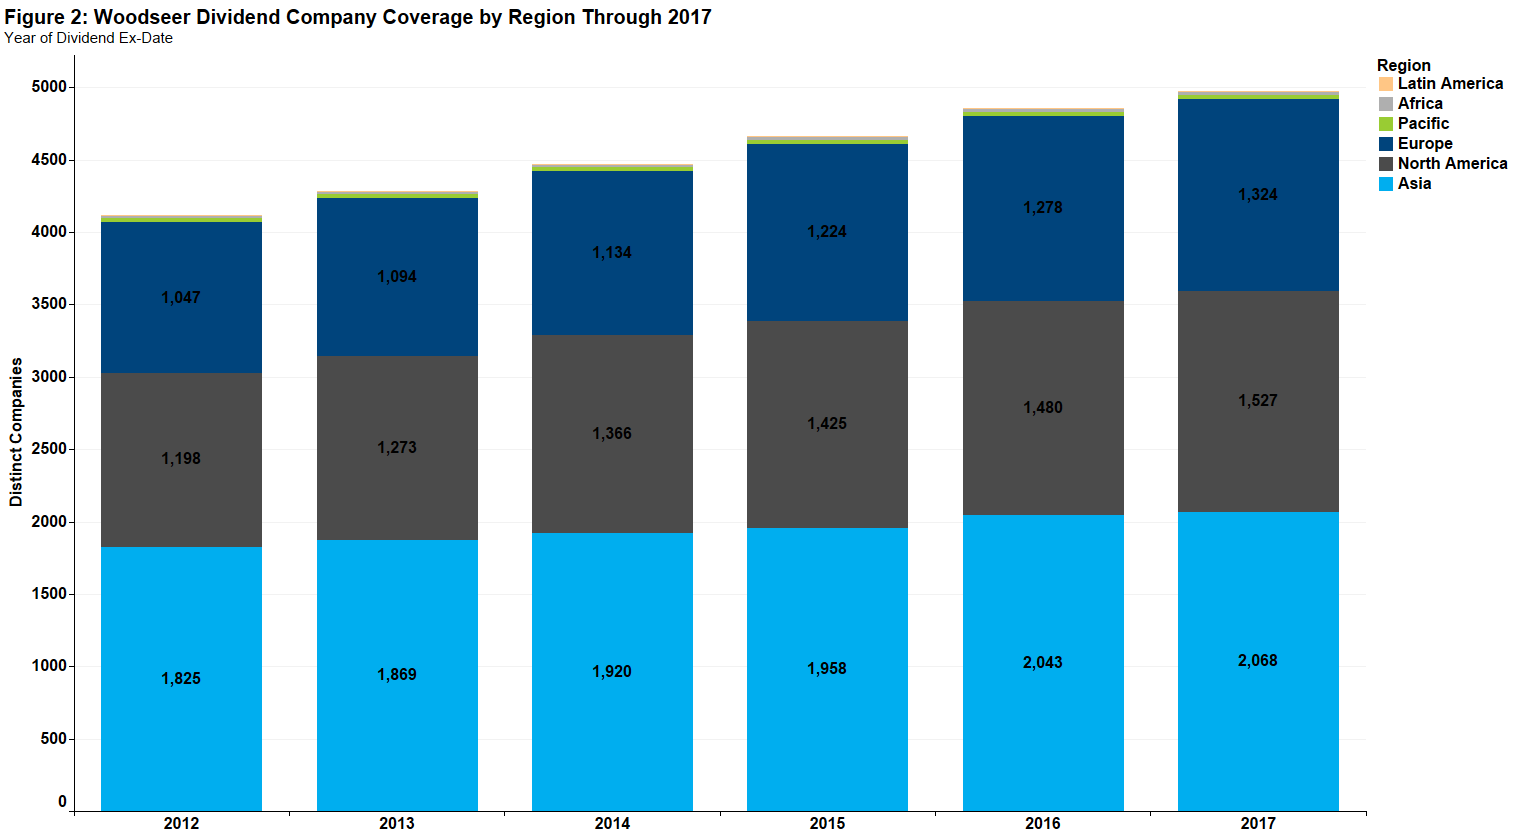
In addition to dividend forecasts, detailed historical payments, dates, and disbursements are provided starting from January 2012. Included in the feed are the associated exchange rates, shares, amounts, and currencies for each payment.

Figure 2 shows the yearly company coverage for declared dividends by region.

The Differentiators
The key advantage of Woodseer’s “algorithm plus analyst” approach is accuracy. By incorporating its analysts’ market research into the algorithmic feedback loop, each forecast strengthens and refines the next.
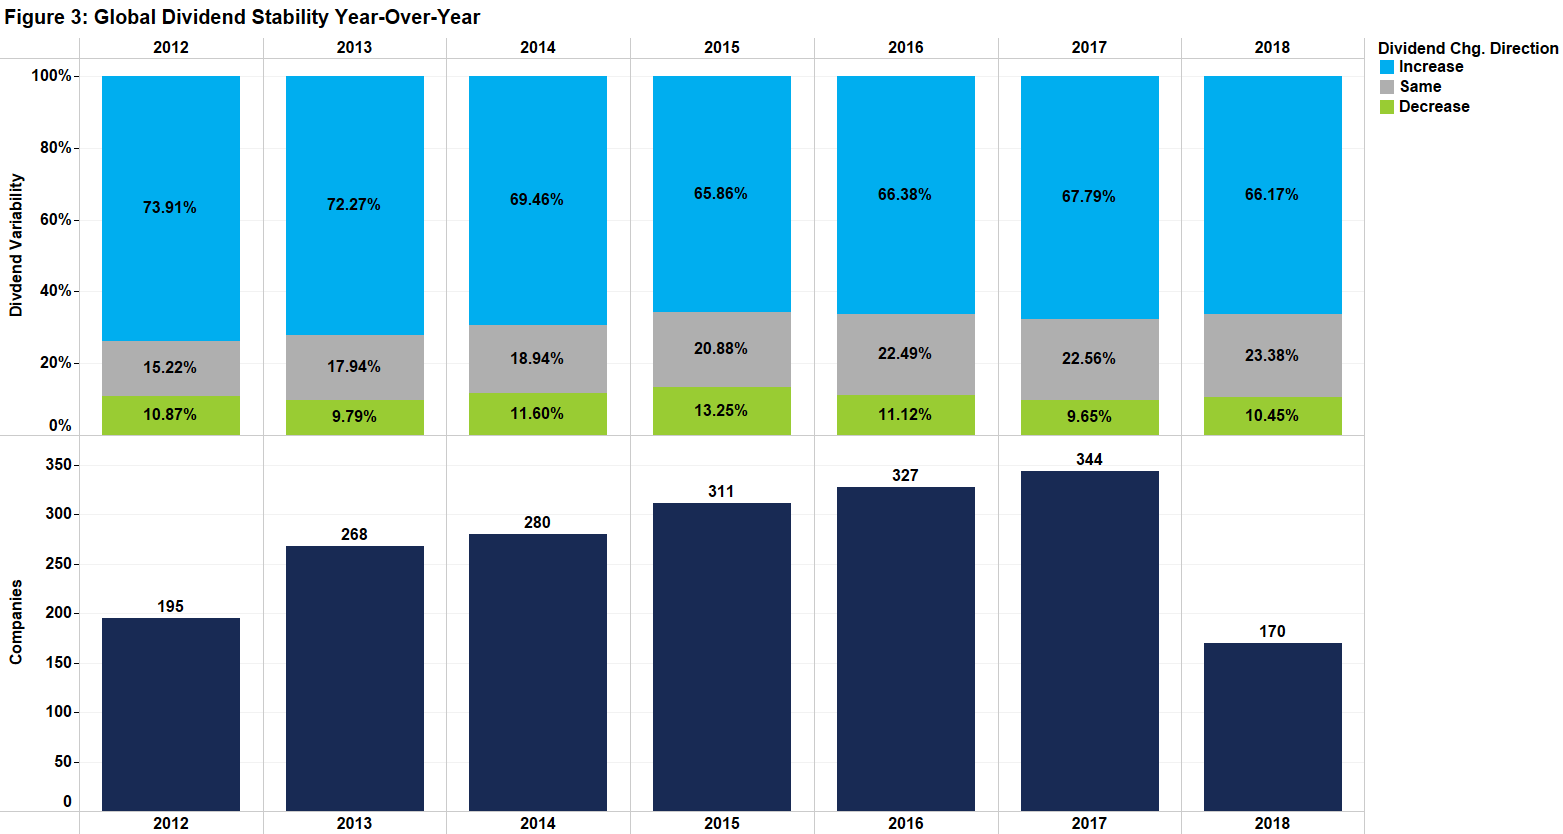
The general perception is that once a dividend is initiated it is difficult for a firm to modify payments. Woodseer’s universe, however, tells a different story. Figure 3 showcases that on average fewer than 20% of dividends have remained stable since 2012. Dividend variability translates into an advantage for funds specializing in a dividend capture strategy, equity option valuations, and endless other applications if they can incorporate a more accurate forecast.

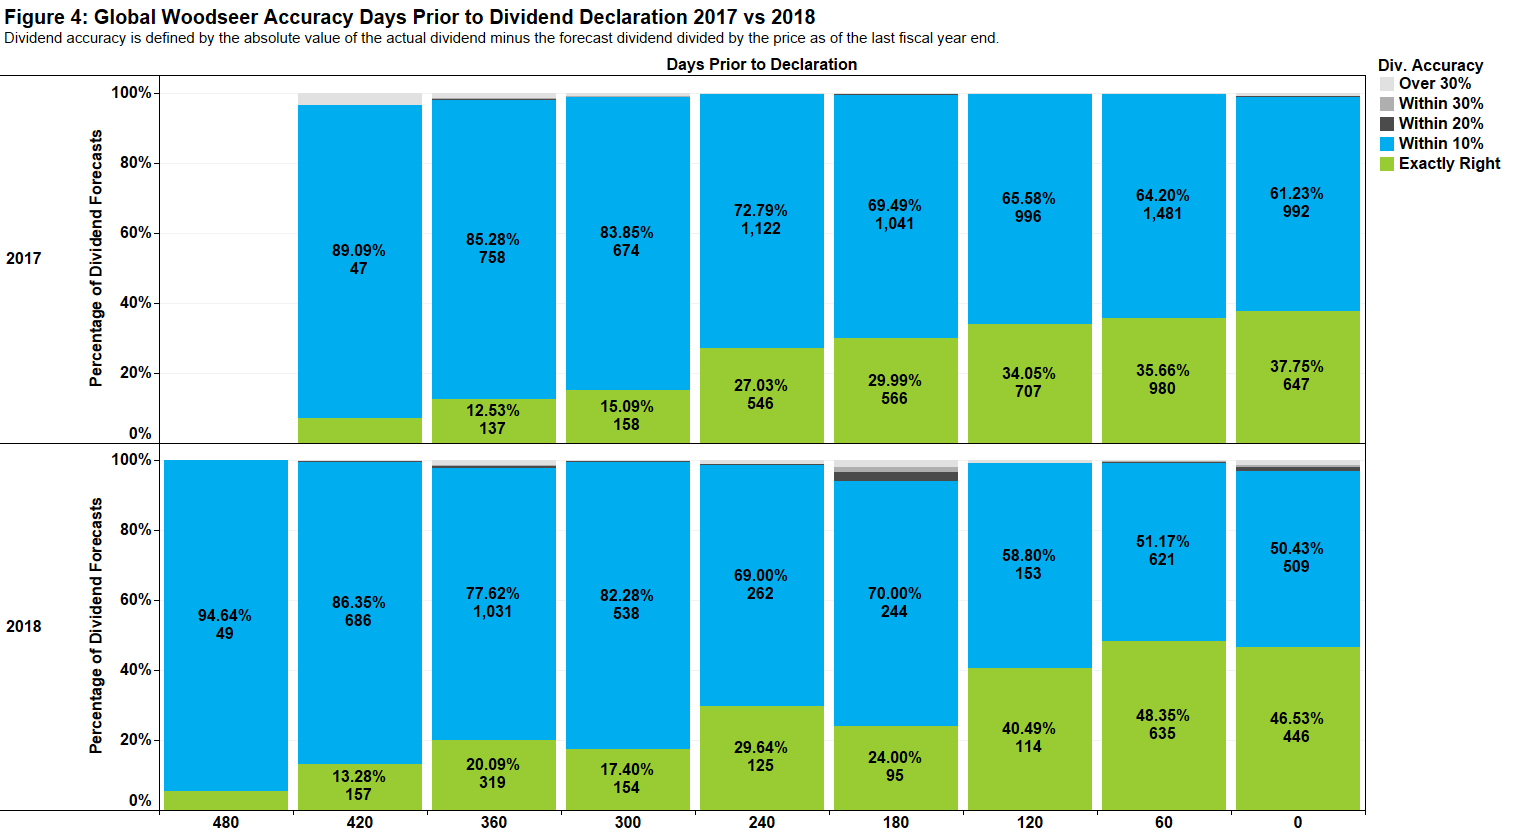
Utilizing the date time stamped records for each forecast made starting in January 2017, Woodseer’s accuracy can be tracked over time. Figure 4 examines accuracy through time by evaluating forecasts relative to the number of days prior to the dividend declaration date. While only at the mid-point of 2018, a clear increase in accuracy can be seen. The 120, 60, and zero days prior date groups exhibit an uptick in forecasts that are exactly right from 34% to 41%, 36% to 49%, and 38% to 47% respectively. While a larger sample size would be required to ensure statistical significance, there is a clear trend of increasing accuracy.

Example Use Case
Understanding dividend changes, omissions, and initiations are crucial for all types of financial professionals. Fundamental analysts can augment existing research to predict future dividend dates and amounts. Discretionary managers can leverage forecasts to identify anomalies between companies in any given sector. Portfolio managers can leverage forecasts as a timing tool for trades. Quantitative investors can develop or augment existing alpha factors. In all cases, accuracy matters. To better assess Woodseer’s data, it can be compared to the Wall Street consensus estimates provided by FactSet Estimates.
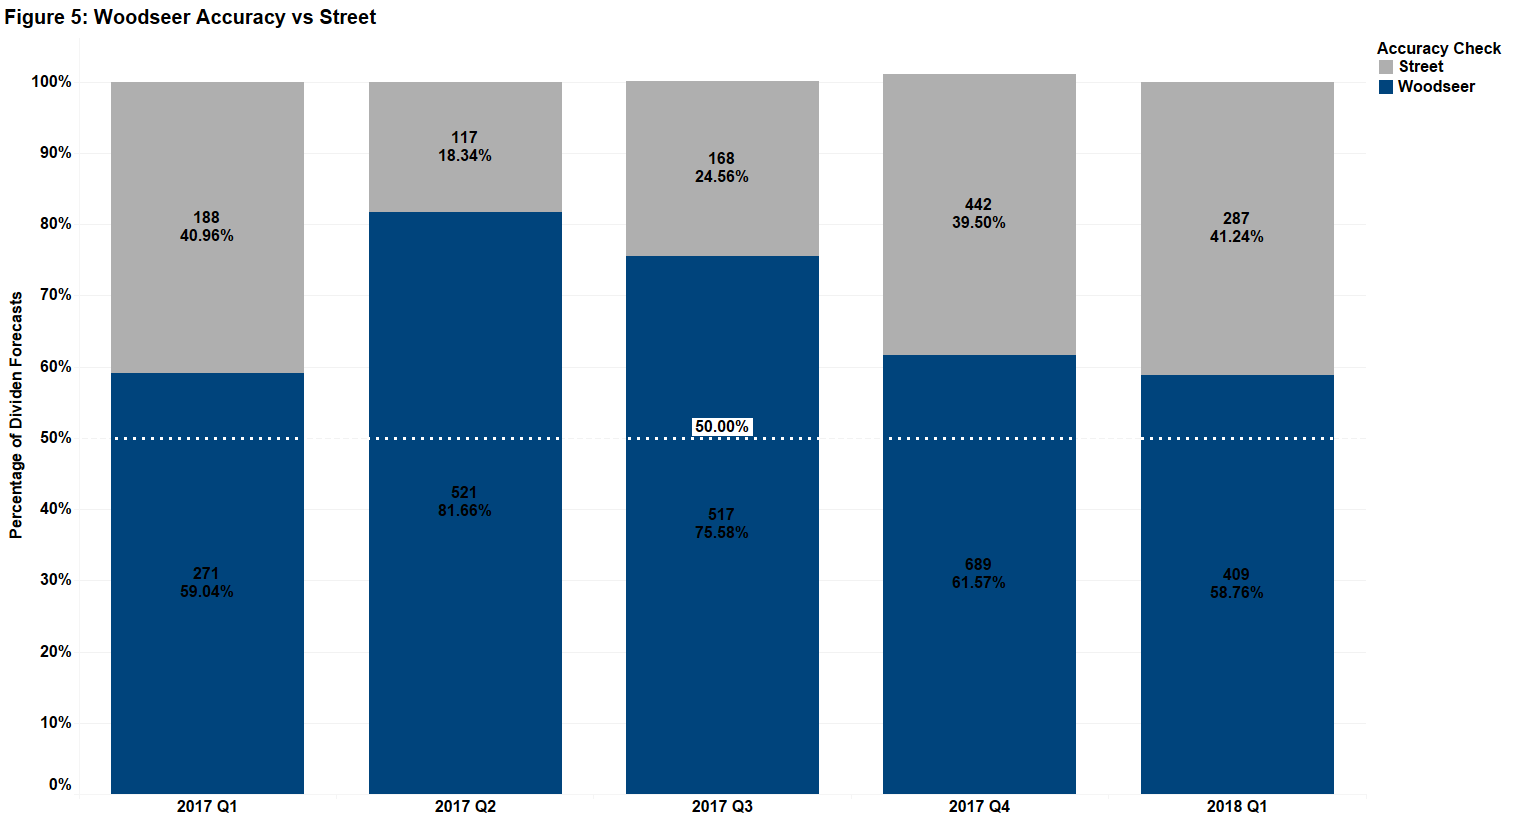
Figure 5 shows the “win” percentage of Woodseer vs. the Street. The winner here is defined by the estimate proximity to the actual reported value. For each quarter, Woodseer’s forecasts are closer to the actual reported amount.

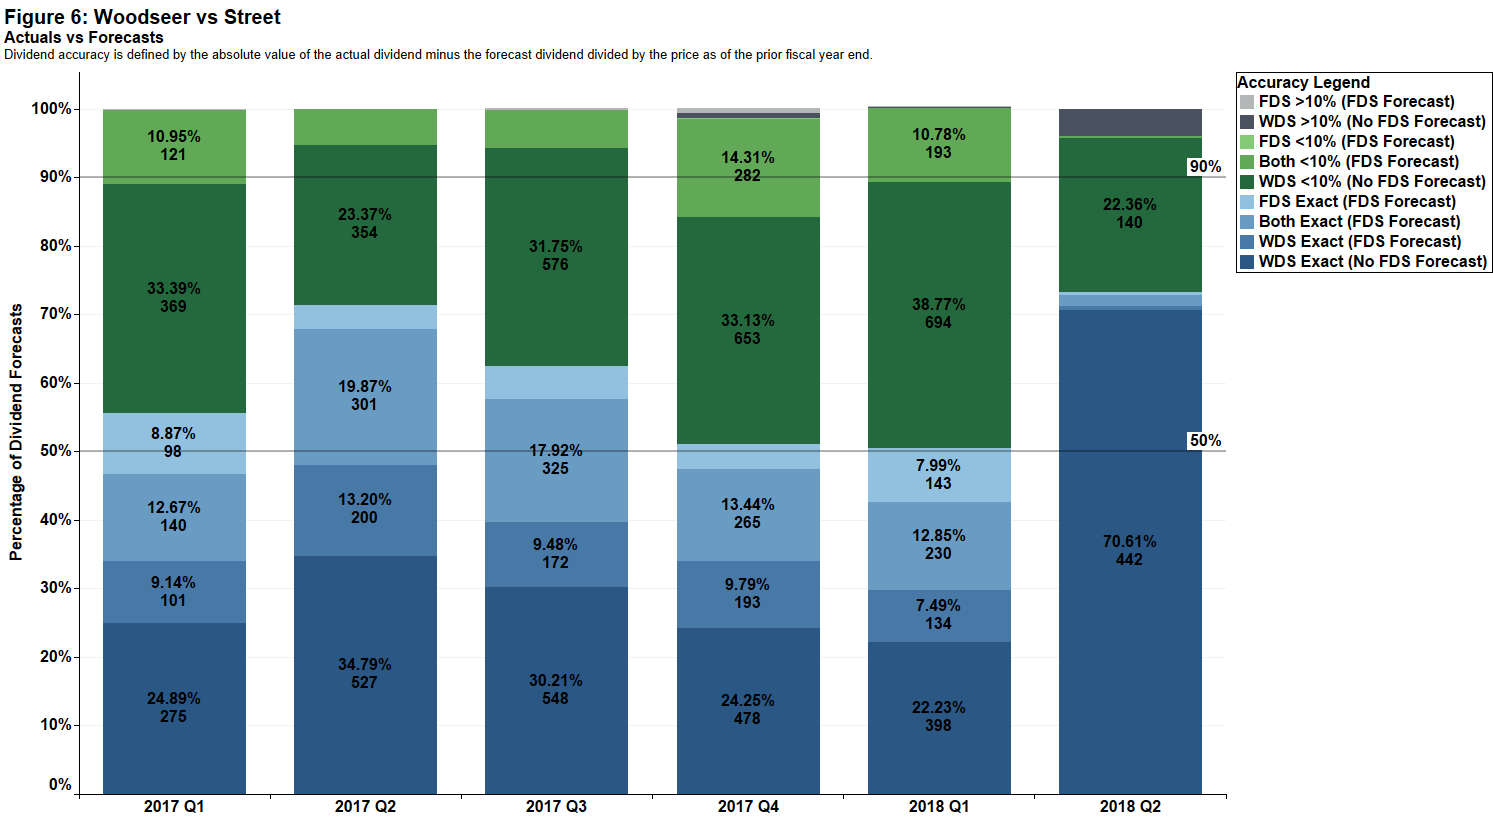
Figure 6 examines the percentage of forecasts with a zero surprise. In other words, these forecasts are spot-on. For this comparison, only companies covered by both FactSet Estimates and Woodseer were included. It is important to note that a company can be covered by FactSet Estimates but analysts may not provide an estimate for dividends.
In comparing the two sources, it is apparent that they are complementary. In aggregate, each quarter resulted in at least 50% of estimates being spot-on and over 90% of estimates being within 10%. Woodseer’s forecasts where spot-on for about 50% of forecasts each quarter with 20-30% not having an accompanying Street forecast. In cases where each source provided a forecast, there are between 5-12% of estimates where only one source resulted in a zero surprise.

While future research will focus on how these two sources can be blended and applied within a single strategy, high level analysis demonstrates Woodseer’s Dividend Forecast DataFeed’s overall accuracy.
For more information on Woodseer, please visit the partner page on the Open:FactSet Marketplace. If you have any questions please contact us at sales@factset.com.