The Basics
FactSet Estimates is a global estimates database, comprised of over 800 contributors, built upon providing constituency and transparency. The FactSet Estimates database covers the markets of 90 countries, providing comprehensive Sell-Side broker estimates and statistics with intraday updates and 20+ years of history.
FactSet’s Estimates broad coverage, deep history and accuracy make it a widely relied upon source throughout the industry, often cited by top financial outlets such as the Wall Street Journal and CNBC.
The product information and content statistics contained in this document are as of April 2019.
The Coverage
FactSet Estimates is a global database covering over 16,000 active companies across 90 countries and all sectors and industries. Historical estimates are available globally starting in 1999 with coverage for European companies extending back to 1997.


FactSet Estimates is composed of four primary categories of information:
- Consensus Estimates: Current and historical snapshots of broker consensus estimates.
- Detail Estimates: Current and historical estimate values tied to individual analysts and brokers.
- Actuals: Company reported or broker actual, denoted by flag within feed.
- Broker Actual: Broker Median consensus that can be updated up to 100 days post the fiscal period’s report date.
- Company Actual: Collected directly from a company’s press release when item is EPS, Sales, Net Income or Industry Item. FactSet will also collect a company actual on any item that has a guidance provided for that item/period.
- Guidance: Historical company reported guidance values.
The Differentiators
A chief focus of the FactSet Estimates database is to provide timely and accurate content that has unparalleled transparency and flexibility. 90% of FactSet’s Estimates are collected directly from research reports. The remaining 10% are collected from flat file feeds directly from brokers, checked against the research reports for quality assurance. All data included and entered within the database is subject to hundreds of algorithmic quality control checks. Any data point that fails to pass any algorithm is considered an outlier and is then examined by the FactSet Quality Specialist team. This collection process means that FactSet’s content teams have better context and transparency when auditing data. For example, brokers often will use different methodologies in their estimates and these methodologies can change over time. By collecting directly from research reports, FactSet is able to identify these non-conforming methodologies and account for them when generating a consensus.
Another key differentiator of the FactSet Estimates DataFeed is its use of FactSet Symbology, allowing for easy linkage to other content. FactSet Estimates data naturally pairs well with other FactSet DataFeeds such as People and XML Earnings Transcripts. By linking the Analyst making estimates to a FactSet Entity Identifier, connecting to a variety of data sets is intuitive and frictionless. For additional insight into the value of connecting FactSet Estimates to earnings transcripts, see the At A Glance for Document Distributor - XML Company Events & Transcript DataFeed
Example Use Case
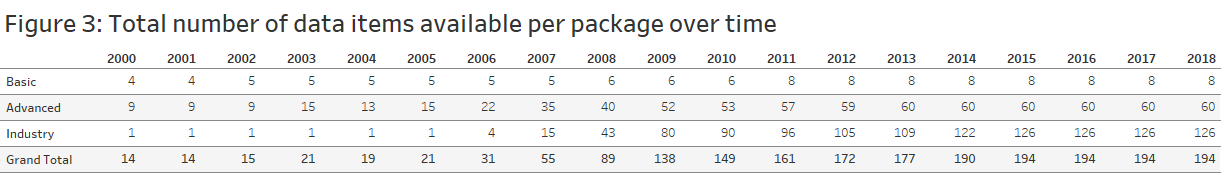
Key performance indicators, or KPIs, provide additional insight into a company’s operations outside of the standard metrics such as Sales and EPS. While new alternative datasets look to break into the KPI space, FactSet Estimates has over a decade of experience providing these industry specific figures. With 125 metrics and counting, FactSet Estimates is continually expanding coverage around newly emerging industries.
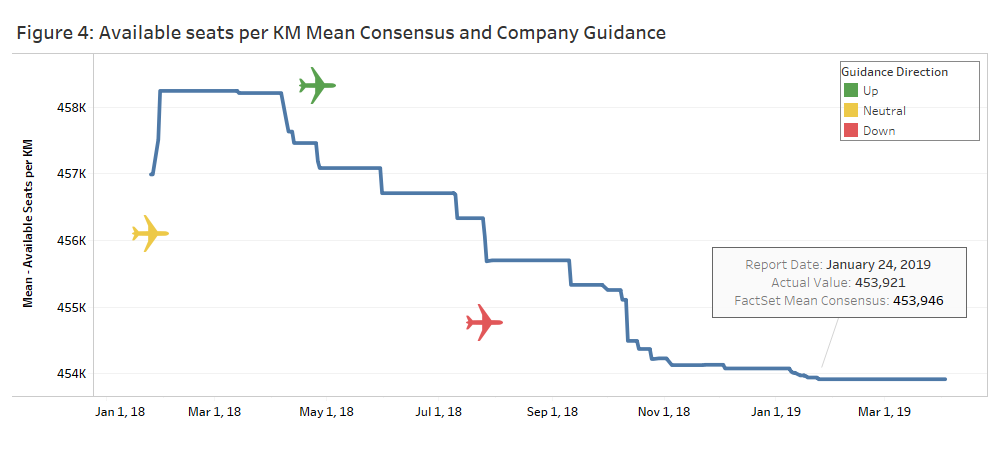
Focusing specifically on Airlines, FactSet Estimates provides 9 industry metrics. This includes items such as load factor, available seats per KM, and revenue per thousand passengers. FactSet will provide not only the Estimates and Actuals, but Guidance as well when the company has issued it.
The chart below contains the change over time in mean consensus values for the American Airlines KPI: available seats per KM. The data is for American Airlines 2018 fiscal year. As depicted, the airline issued and updated their guidance for the KPI three times throughout the year. With FactSet Estimates, company issued Guidance’s affect, or lack thereof, on Broker estimates can be gauged.
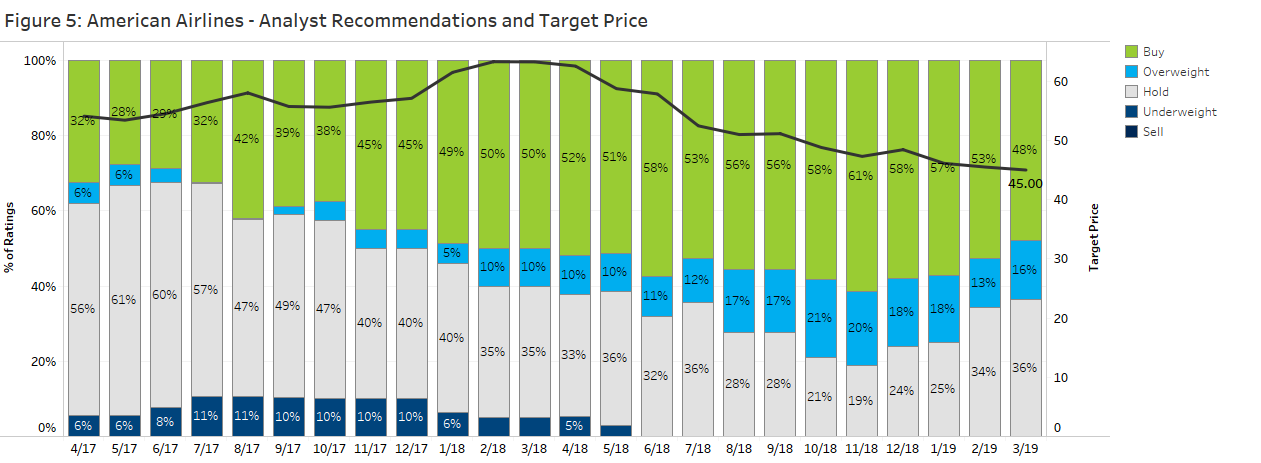
In addition to estimates on reported values such as sales and EPS, as well as KPIs, FactSet Estimates delivers analyst recommendations. These recommendations are a measure of an analyst’s predictions on future price movement, providing insight into market expectations of a security. Figure 5 highlights the analyst recommendations and consensus price target for American Airlines.
If you have any questions or would like to learn more about any of the content mentioned above, please contact us at sales@factset.com.
Please visit the product page on the Open:FactSet Marketplace for more information: FactSet Estimates.