The Basics
Kavout K Score is a predictive equity rating data feed powered by machine learning (ML) technologies. Kavout takes in a diverse array of datasets including fundamentals, pricing, and alternative data, then uses a combination of statistical analysis and ML techniques with ranking algorithms to deliver an actionable, easy-to-understand 1 to 9 equity rating score. Kavout K Score has coverage for United States traded equities and ADRs as well as the China A-Shares, United Kingdom, and Germany markets, with more countries coming soon.
The product information and content statistics contained in this document are as of June 2019.
The Coverage and Feed Structure
K Score is offered as regional packages with coverage for the United States, China A Shares, United Kingdom, and Germany markets. The K Score equity rating is delivered as an integer with possible values ranging from 1 to 9. History is available for U.S. stocks from January 2012, for China A Shares, UK, and Germany history is available from January 2013.
| REgion |
Coverage |
History |
| United States |
All tradable equities on US exchanges – NYSE, Nasdaq
~3100 stocks actively covered as of June 2019
|
From January 2012 |
| China |
China A Shares traded on Shanghai and Shenzhen exchanges.
~800 stocks actively covered as of June 2019
|
From January 2013 |
| United Kingdom |
Constituent stocks of the FTSE 100 and FTSE 350 indices traded on the London Stock Exchange
On average 343 tickers are rated and ranked daily
|
From January 2013 |
| Germany |
Constituent stocks of the HDAX and MSCI Small Cap indices traded on the Frankfurt Exchange
On average 179 tickers are rated and ranked daily
|
From January 2013 |
The Differentiators
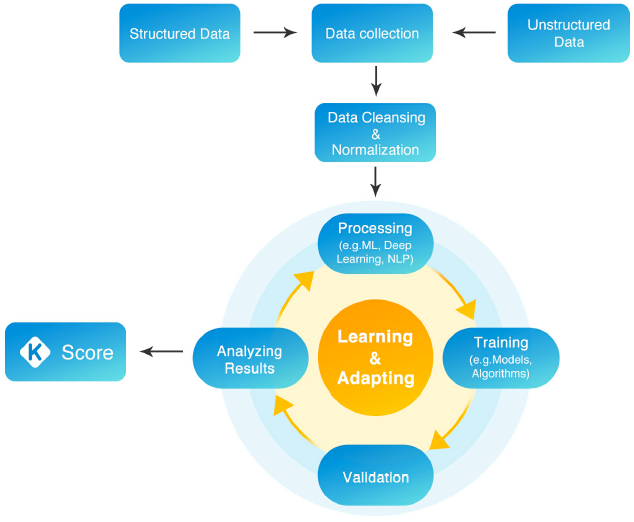
Key differentiators of the K Score Data Feeds are the application of ML techniques along with extensive experience in finance of Kavout analysts, diverse data sourcing, and international coverage. At a high level, Kavout’s intelligence platform is designed to gather and process various large complex datasets. Kavout applies its proprietary ML models and ranking algorithms which identify valuable relationships and patterns forming in the financial markets to generate predictive analytics. As Kavout’s ML platform processes new data, it progressively improves its predictive ability and dynamically adapts to the market through Reinforcement Learning.
The K Score Data Feed enables investment professionals to take advantage of these techniques and technologies. Drawing from close to 20 years of experience in investment research, AI, and ML, Kavout’s team has been developing its suite of products and services since 2016. Kavout’s mission is to democratize Machine Learning by making them accessible for all investors.
Another important aspect of the K Score Data Feed is the data sourcing. Kavout takes in a vast and diverse mix of financial and alternative data from multiple sources. Over 200 factors and signals are considered including but not limited to:
- Factor models such as quality, value, growth, momentum, profitability, volatility, and more
- Financial statement information such as sales, net income, and EBITDA
- Technical indicators such as MACD, RSI, Z-Score, and M-Score
- Price patterns such as chart and candlestick patterns
- Time series of the features above as well as price-related data
- Sentiment information such as insider and options trading activities and text analytics
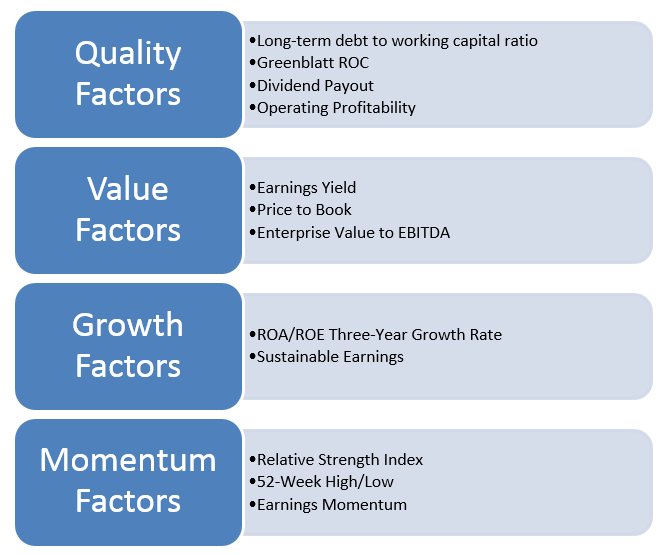
The table below shows some of the features that are included in the quality, value, growth, and momentum factor models.
Another advantage to the K Score dataset is international coverage of the China A-Shares, UK, and Germany markets. China A-Shares trade on two exchanges; the Shanghai Stock Exchange (SSE) and Shenzhen Stock Exchange (SZSE). The SSE is the world’s fifth largest stock market by market capitalization at $5.5 trillion as of April 2018. The combined market capitalization of the listed companies on the SZSE is $2.285 trillion. It is the eight largest stock exchange in the world and the fourth largest in Asia.
Example Use Case
With the Kavout K Score Data Feed investors can quickly incorporate ML technologies into their investment process. The Data Feed provides an easily interpreted predictive equity rating score. The Kavout K score is applicable to a variety of workflows. Three typical uses are quantitative applications, fundamental research, and for risk-mitigation.
- K Score is a stock rating score of 1 to 9. A higher K Score (7-9) assigned to a stock indicates a higher probability of outperformance over the next month, whereas a lower K Score (1-3) indicates a lower probability of outperformance. Investors with a longer investment horizon may prefer to look at stock’s 1- or 3-month average K Score.
- For quantitative users, K Score can be used as a signal that can be incorporated into investment models to help make buy/sell decisions and optimize portfolio weighting.
- For fundamental users and research analysts, K Score can be used as a screener to validate research and help uncover new investment ideas that weren’t on their radar before.
- K Score may also be used for risk mitigation in equity portfolios by avoiding stocks with low K scores.
For more information on Kavout’s backtests utilizing K Score as a buy/sell signal see the Backtest and Performance Results on Kavout’s K Score product pages for the U.S., China, UK, and Germany.
If you have any questions, please contact us at sales@factset.com. Please visit Kavout K Score product pages on the Open:FactSet Marketplace for more information.