Basics
Content Category: ESG
Open:FactSet Page: Click here
Setup a Demo and Access Today: sales@factset.com
FactSet's Truvalue product suite applies machine learning to uncover risks and opportunities from companies’ environmental, social, and governance (ESG) behavior, which are aggregated and categorized into continuously updated, material ESG scores. It focuses on company ESG behavior from external sources and includes both positive and negative events that go beyond traditional sources of ESG risk data.
Truvalue extracts, analyzes, and generates scores from millions of documents each month collected from more than 150,000 data sources in over 30 languages. Sources include:
- Local, National, and International News
- NGOs and Watchdog Groups
- Trade Blogs and Industry Publications
- Social Media
Data Overview
Asset Class: Public and Private Companies
Data Frequency: Event-Driven
Delivery Frequency: Daily
History: Data available back to 2007
The FactSet Truvalue SASB Scores DataFeed tracks 260,000+ public and private companies worldwide, including constituents of major indices such as the S&P 500, Russell 3000, MSCI All Country World Index, and others.
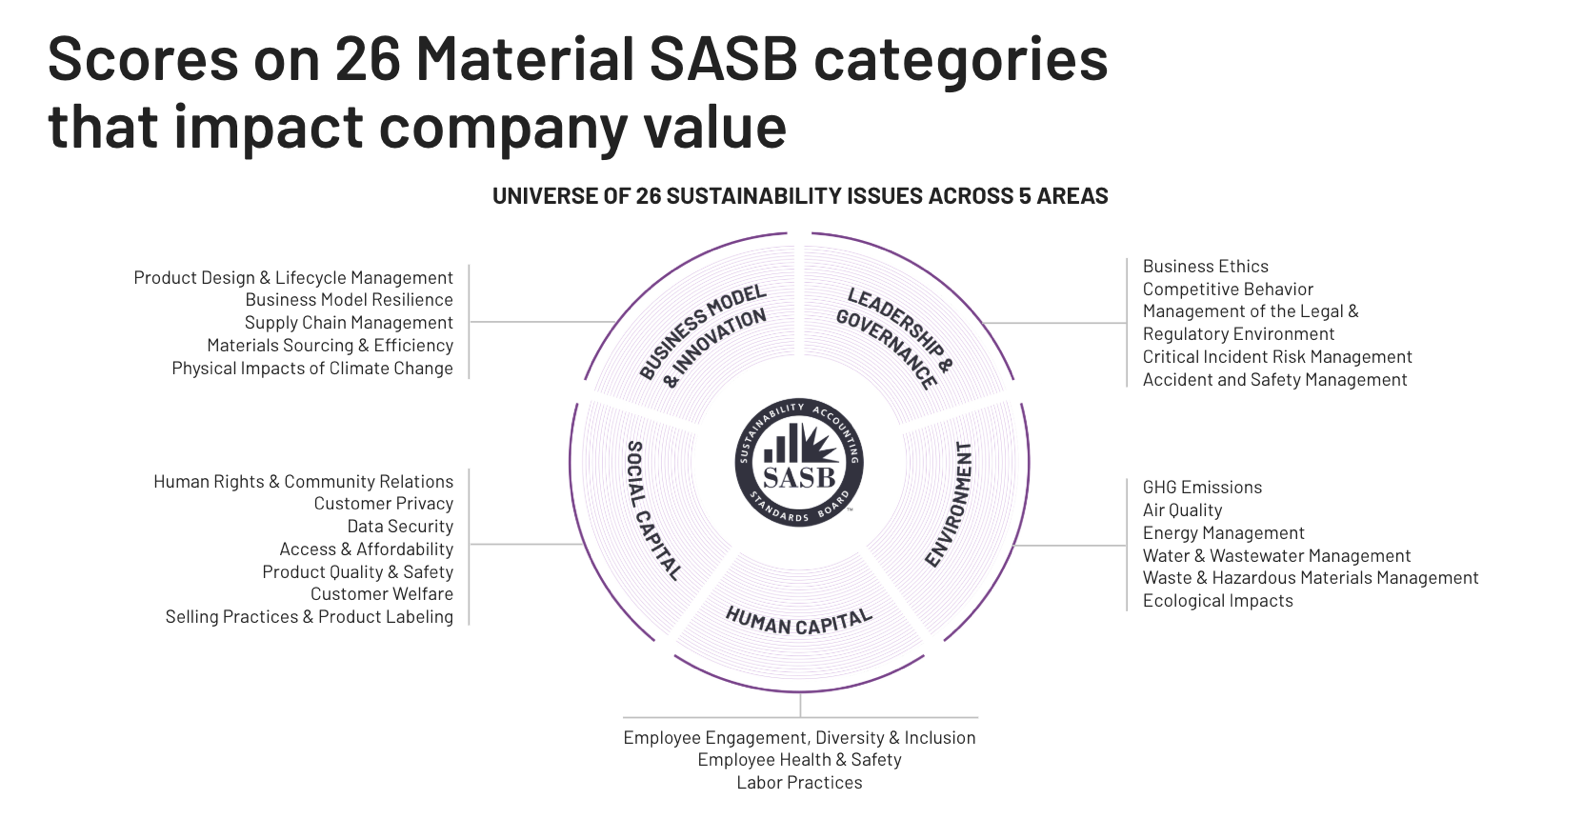
In order to calculate Truvalue ESG scores, large volumes of unstructured ESG data are processed and categorized into 26 categories defined by the Sustainability Accounting Standards Board (SASB) materiality framework. The image below displays the SASB categories, highlighting the massive volume of ESG information tracked and scored by Truvalue.
Data Methodology
The majority of ESG data is derived from company-provided materials, representing an inside-out perspective on ESG. Truvalue takes an outside-in perspective by capturing views of analysts, advocacy groups, and government regulators, all as published by independent media. With a focus on both positive ESG behavior as well as controversies, Truvalue goes beyond risk identification by uncovering opportunities hidden in unstructured data.
Articles collected from the sources above are analyzed to deliver scores for ESG factors that have been identified by the Sustainability Accounting Standards Board (SASB) as having a material impact on company value by industry and sector. The SASB framework highlights industry-specific standards and an investor-centric approach to recognizing intangible value and risk factors from ESG data. Firms can combine any of the material SASB categories to create their own unique composite score.
Unlike traditional ESG data sets that are focused on annual ratings and periodic corporate disclosure, Truvalue monitors company ESG behavior at the speed of current events. This enables investment professionals to more efficiently incorporate material, market-moving information into their investment process by leveraging the following score types provided in the data feed:
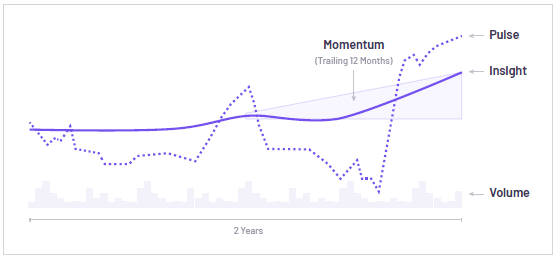
- The Insight Score measures a company’s longer-term ESG track record.
- The Pulse Score measures the near-term performance changes that highlight opportunities and controversies.
- The Momentum Score measures a company’s ESG behavior trend over time.
- The Volume Score measures the information flow or number of articles about a company and is represented as an aggregate value over the past 12 months.

- Adjusted Insight measures company ESG performance, generating scores for lower-volume and zero-volume firms by blending company scores with industry medians.
- Industry Percentiles offer context on company-adjusted Insight scores relative to peers in the same SICS Industry.
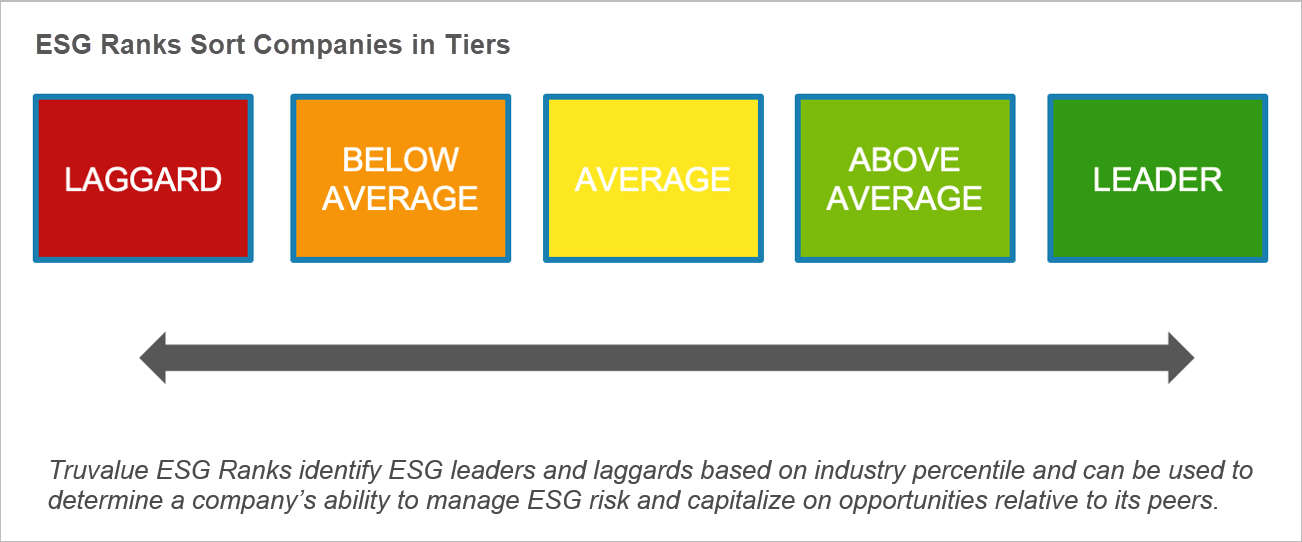
- ESG Ranks break down a peer universe into the following categories: Laggard, Below Average, Average, Above Average, or Leader, directly mapping from Industry Percentiles.
Use Cases
Truvalue’s timely ESG data can be used to construct and monitor a portfolio of top ESG performers. A recent study by FactSet finds that companies with strong information flow (the Volume Score), good overall ESG scores (the Insight Score) outperform global and regional benchmarks over a 12-year period (2007-2019) in terms of investment performance.
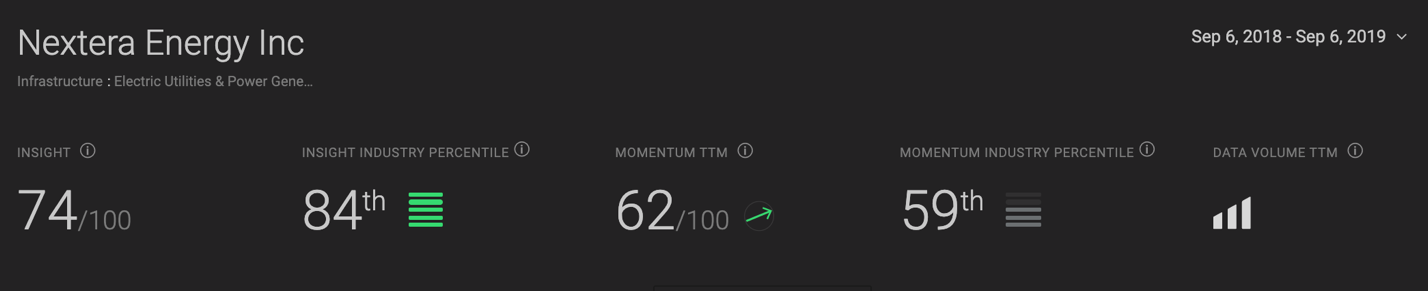
For example, electric utility and power generator NextEra Energy (NEE) is ranked highly in a screen based on these factors. The FactSet Truvalue SASB Scores DataFeed provides insight into NextEra’s performance as events unfold over time. Figure 1 shows the Insight, Momentum, and Volume scores for NextEra Energy, together with its industry percentile, reflecting its performance relative to industry peers. NextEra scores above the neutral score of 50, representing overall positive and improving performance.
Figure 1: NextEra Energy’s ESG performance based on Insight, Momentum, and Volume Scores
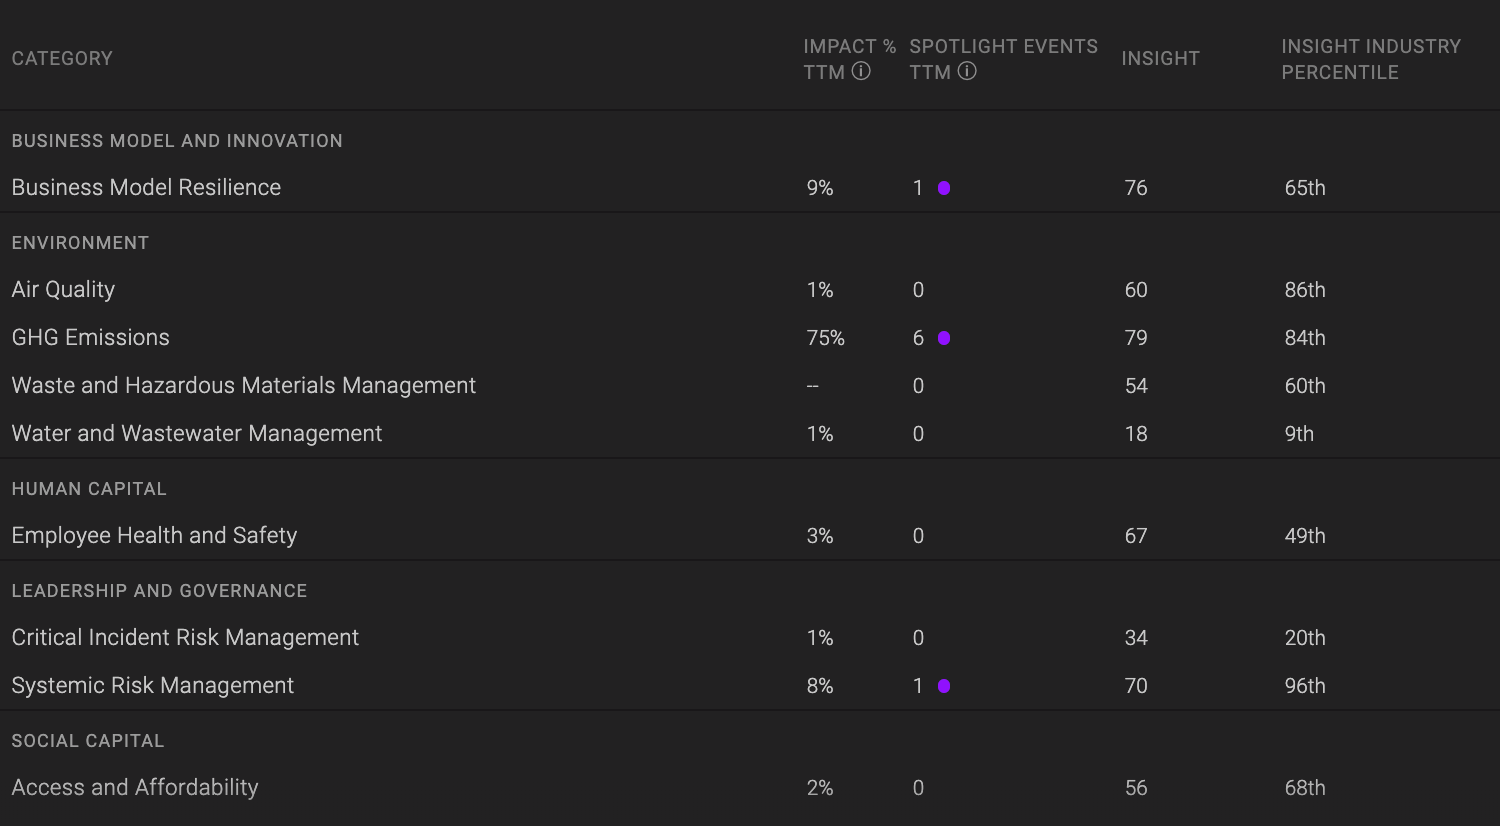
You can use the underlying data at the category level to understand what drives these scores and how the company compares to its peers over time. It is worth focusing on the ESG topics that SASB identifies as material for an electric utility and power generating company like NextEra Energy. These include the nine categories (out of 26 available categories) shown in Figure 2.
Figure 2: NextEra Energy’s Performance on the Material Categories Identified by SASB

NextEra has strong positive performance and a long-term Insight score industry percentile of 84th in the category of GHG Emissions. The company also scores highly in the category of Systemic Risk Management. The company is in the 50th percentile or better for seven out of nine categories that SASB considers material.
With this data, it’s possible to track the company’s ESG performance over time for any combination of categories. Figure 3 below shows the overall ESG performance over time for material categories. The figure shows that NextEra Energy not only has positive Insight performance today but it has also been far outperforming its industry peers over the TTM period, and the gap has been significant, as can be seen by the purple (NextEra) and green (industry average) solid lines. The bars at the bottom of the chart represent a steady stream of information flow (daily volume) on the company, which can also be an interesting signal by itself.
Figure 3: Timeline of Score Changes for NextEra Energy for Material Categories
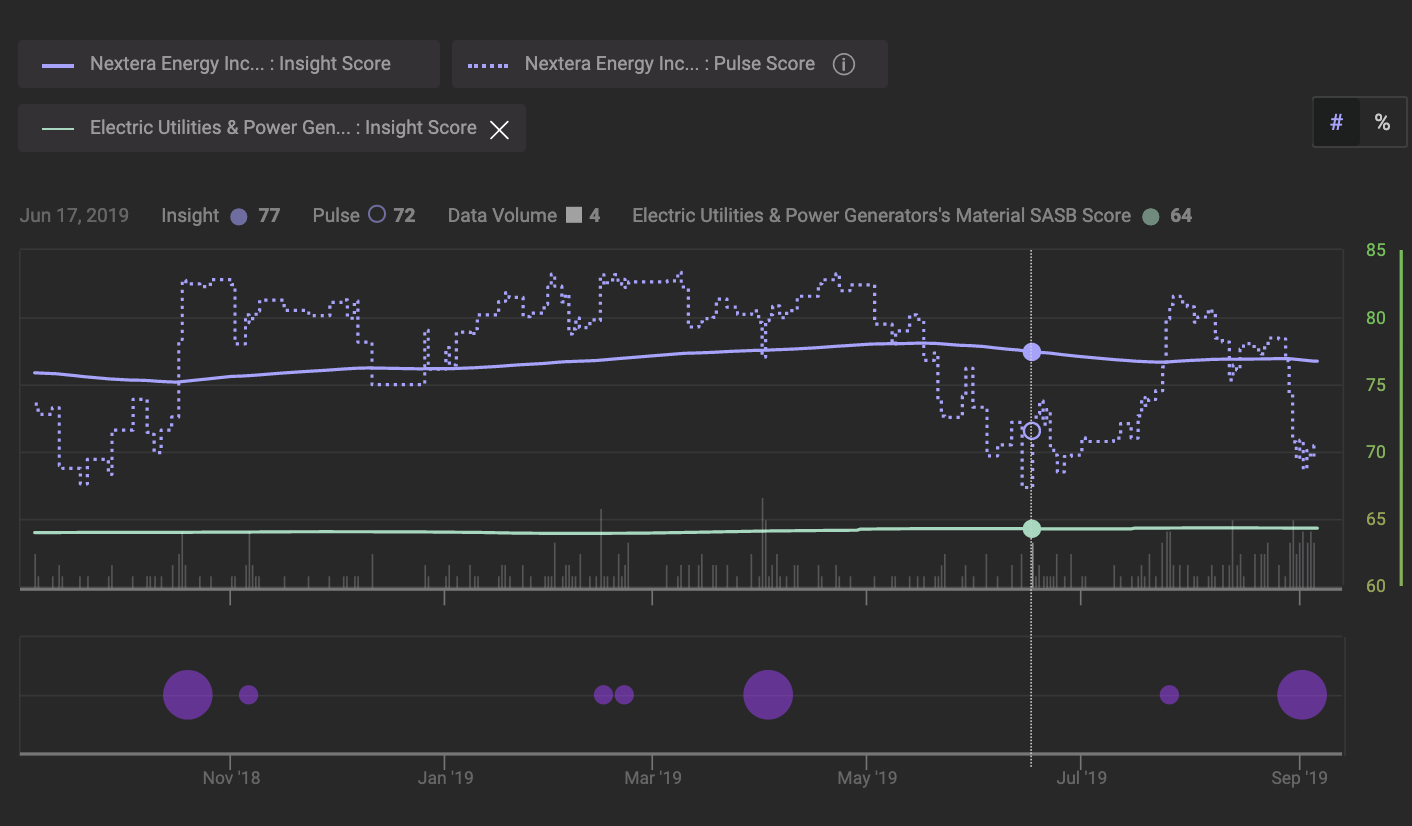
Drilling down further, Figure 3 also shows a historical timeline of daily Pulse scores, a short-term measure of both positive and negative ESG incidents.
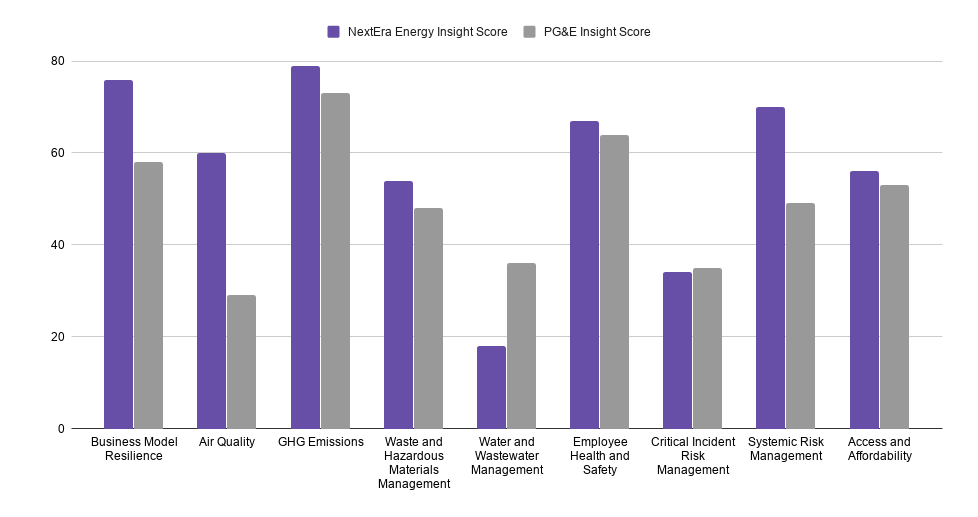
Figure 4: Peer Comparison of Insight Scores in Material Categories for NextEra Energy and PG&E

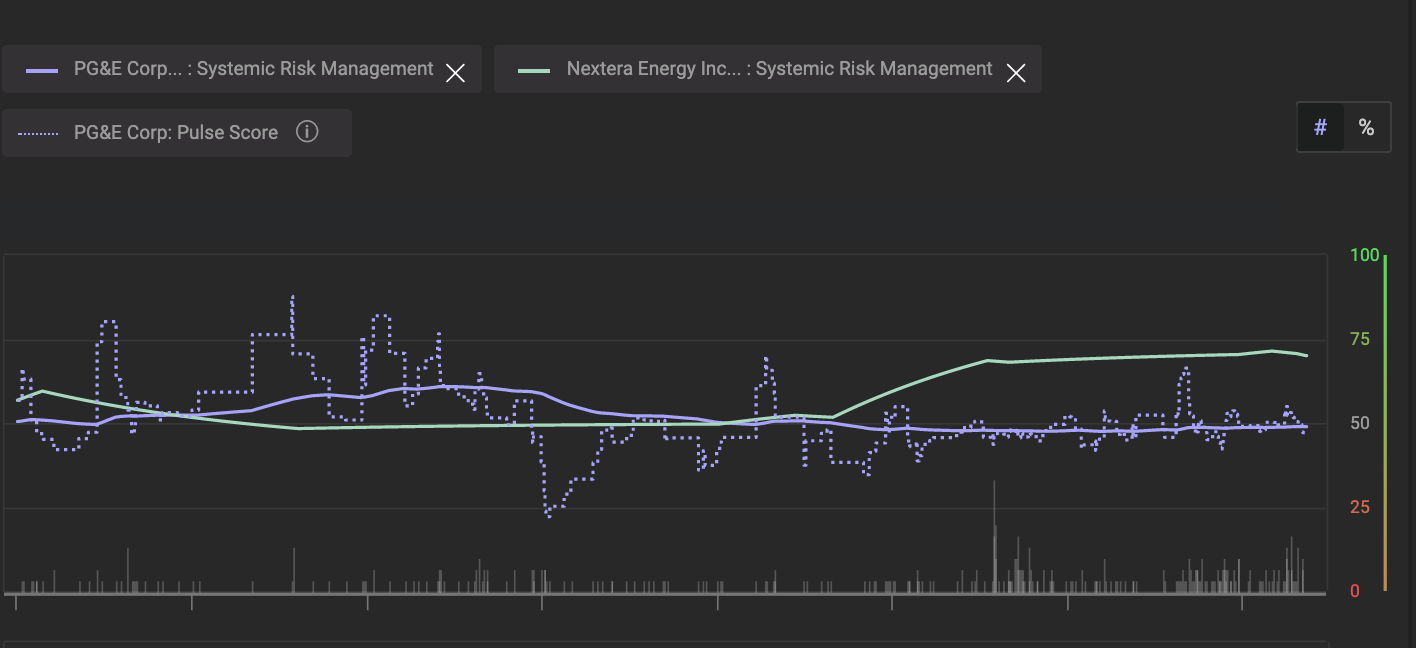
As seen above, NextEra Energy outperforms on most material categories compared with embattled and nearly bankrupt PG&E, which has been wracked by controversies including gas line explosions and wildfires that have been attributed to the utility by regulators.
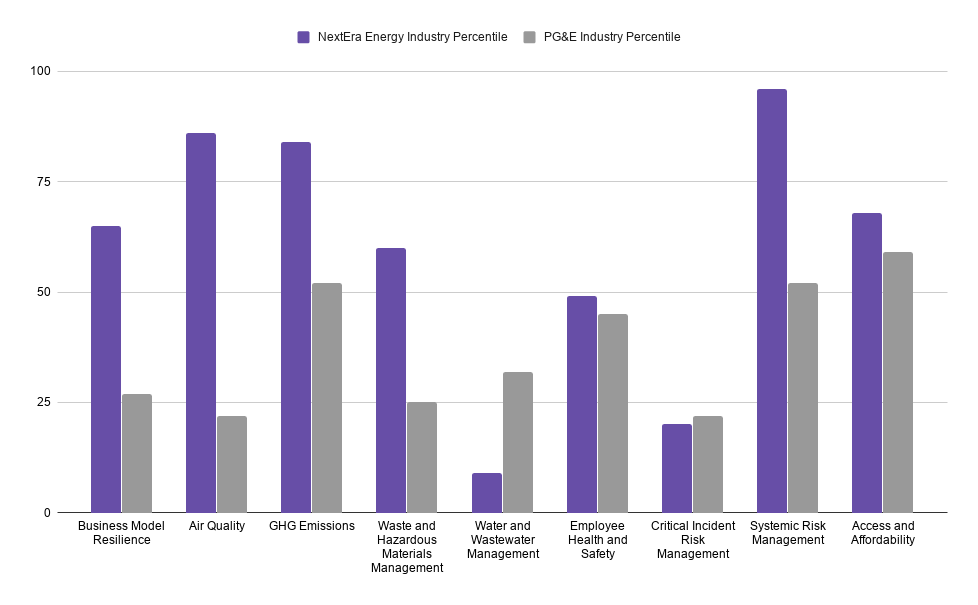
As seen below, the differences in performance grow even larger when looking at Insight percentiles within the companies’ industry peer group for Electric Utilities and Power Generators.
That is because industry peers’ performance can tend to be grouped in a narrow band within the 0-100 scoring scale Truvalue uses to assess events. Percentiles make company performance relative within the context of peers.
Figure 5: Peer Comparison of Insight Percentiles in Material Categories for NextEra Energy and PG&E

Figure 6: Comparison of NextEra Energy and PG&E within the Material Category of Systemic Risk Management
Finally, as mentioned earlier, while we are just considering the top and bottom performers of a specific category, it is also possible to use the data to support many different strategies:
- Combine any of the SASB categories to create your own unique composite score
- Aggregate categories to create themes
- Filter using daily and TTM volume figures
The details provided above are as of August 2023.
If you have any questions or would like to learn more about any of the content mentioned above, please contact us at sales@factset.com.
Please visit the product page on the Open:FactSet Marketplace for more information: FactSet Truvalue SASB Scores DataFeed.


Insight/2019/10.2019/scores%20on%2026%20material.png)

Insight/2019/09.2019/nextera%20figure%2010.png)