

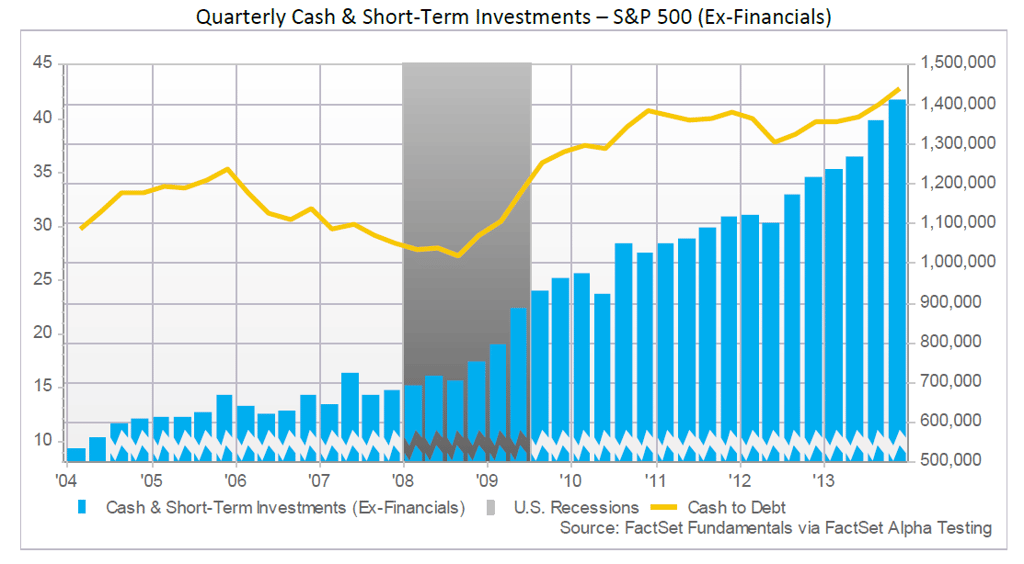
 Cash & short-term investment balances (“cash”) in the S&P 500 (ex-Financials) rose by 13.9% year-over-year and settled at a balance of $1.41 trillion at the end of Q4 2013.
One of the major factors for cash growth was large cash inflows from operations. S&P 500 companies generated $381.5 billion in operating cash flow in Q4, the largest amount in at least ten years. This resulted from 6.2% growth year-over-year, and, due to a decline in fixed capital expenditures (-4.0%), free cash flow (operating cash flow less fixed capital expenditures) grew at an even higher rate of 15.6%. This represented the highest growth in free cash flow since Q3 2011, and increased fourth quarter free cash flows to their highest quarterly level ($214.7 billion) in at least ten years.
Seven of the nine sectors under consideration grew quarterly free cash flow year-over-year, with the Industrials sector showing the largest growth (+24.9%). General Electric led the group ($8.0 billion in free cash flow) due primarily to strong net income and lower capital expenditures. But Lockheed Martin had the highest year-over-year improvement (+$2.4 billion), due to unfavorable changes in working capital in Q4 2012. Overall, though, Apple had the highest free cash flow ($20.3 billion) in Q4 from strong holiday sales. However, this sum represented a decline of $0.8 billion year-over-year.
Six of the nine sectors grew cash by at least double-digit rates year-over-year. In addition, the three sectors which showed declines in cash had an insignificant impact on the index-level balance. Two of the three sectors—Consumer Discretionary and Energy—showed declines of less than 3%, and the Utilities sector’s 9.8% decline impacted a small fraction of the aggregate cash balance. The Utilities sector has the lowest cash balance in the index by more than a factor of two.
On the other hand, the three sectors with the largest cash balances—Information Technology, Industrials, and Health Care—all grew cash at double-digit rates (12.8%, 14.3%, and 11.7%). In addition, the elevated growth in cash was positively impacted by Verizon Communication’s $49 billion debt offering in Q3 intended to help finance its $130 billion acquisition of Vodafone Group’s stake in Verizon Wireless. Excluding Verizon, the top six companies by year-over-year dollar-value growth in cash were from these three sectors. And, the top four companies—Microsoft, Medtronic, General Electric, and Google—each grew cash by more than $5 billion year-over-year. Microsoft, which grew cash by $15.6 billion year-over-year, also received significant funds from net debt issuance ($7.0 billion) in the fourth quarter.
On the other end of the spectrum, the Energy sector experienced a decline in cash (-1.1%) for the sixth consecutive quarter. Here, Chevron experienced the largest decline in cash in Q4 (-$5.4 billion) due to capital expenditures that outstripped operating cash flow, and shareholder distributions that further utilized $3.1 billion. In addition, Exxon Mobil was again a major contributor to the decline, as the company showed a $5.4 billion decline in cash and equivalents year-over-year. Though Exxon has generated free cash flow in three of the last four quarters (amounting to $11.2 billion over the year), its significant dividend and regular share repurchase activity have more than utilized cash generated from the business. Net stock purchases and cash dividends paid amounted to $26.8 billion over the trailing year. However, Exxon has worked to trim these outflows, and twice reduced its share repurchase target in 2013. The company went from averaging $5 billion per quarter over a two year period to paying $4 billion in Q2 to an average of $3.2 billion in the second half of 2013.

Industry Analysts Project 29% Increase in S&P 500 Price Over the Next 12 Months
Stay updated on the S&P 500 with this FactSet earnings report noting analysts' predictions for aggregate and sector price...
Where Are Analysts Most Optimistic on Ratings for S&P 500 Companies Heading Into Q2?
Stay updated with this earnings insight from FactSet, summarizing analyst ratings on stocks in the S&P 500 with the start of the...
More Than 65% of S&P 500 Earnings Calls for Q4 Cited “AI”
Stay updated on the S&P 500 with this earnings insight from FactSet, featuring analysis of AI mentions at the aggregate and...
Number of S&P 500 Earnings Calls Citing “Tariffs” Declined for 3rd Straight Quarter
Stay updated on the S&P 500 with FactSet. This report summarizes tariff mentions during earnings calls the past three months at...
The information contained in this article is not investment advice. FactSet does not endorse or recommend any investments and assumes no liability for any consequence relating directly or indirectly to any action or inaction taken based on the information contained in this article.

