

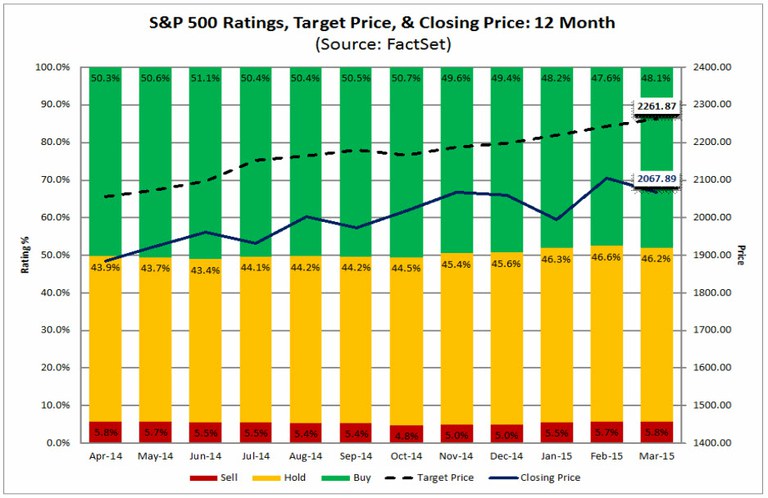
Of the 11,425 ratings on S&P 500 companies at the end of the first quarter, 48% were Buy ratings, 46% were Hold ratings, and 6% were Sell ratings.
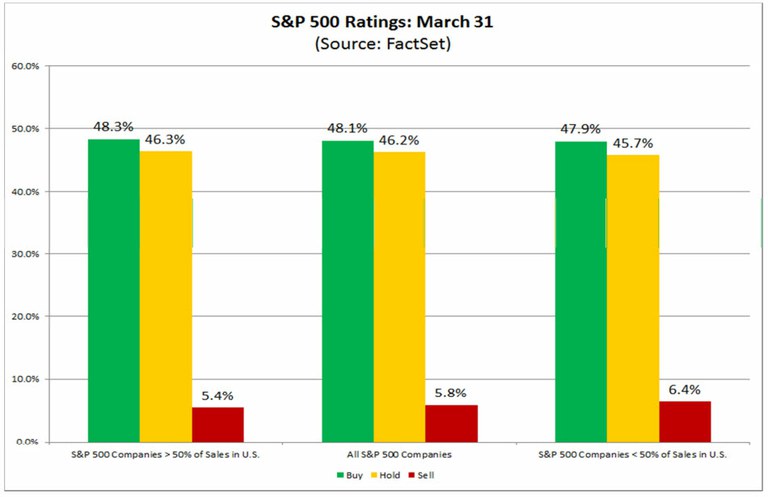
As the start of the Q1 earnings season approaches, there are concerns in the market about the impact of the stronger U.S. dollar and the impact of lower global economic growth on the sales and earnings of companies in the S&P 500. Are analysts more optimistic in terms of their ratings on companies in the S&P 500 with lower global exposure?
The answer appears to be no. FactSet Geographic Revenue Exposure data (based on the most recently reported fiscal year data for each company in the index) can be used to analyze global sales exposure for all the companies in the S&P 500. For this particular analysis, the index was divided into two groups: companies that generate more than 50% of sales inside the U.S. (less global exposure) and companies that generate less than 50% of sales inside the U.S. (more global exposure). The aggregate percentages of Buy, Hold, and Sell ratings for each of these two groups were then calculated.
For companies that generate more than 50% of sales inside the U.S., the aggregate percentage of Buy ratings was 48.3% on March 31. For companies that generate less than 50% of sales inside the U.S., the aggregate percentage of Buy ratings was 47.9%. Thus, the difference in the percentage of Buy ratings between these two groups of companies was slightly less than half a percentage point.
For companies that generate more than 50% of sales inside the U.S., the aggregate percentage of Hold ratings was 46.3% on March 31.For companies that generate less than 50% of sales inside the U.S., the aggregate percentage of Hold ratings was 45.7%. Thus, the difference in the percentage of Hold ratings between these two groups of companies was slightly more than half a percentage point.
For companies that generate more than 50% of sales inside the U.S., the aggregate percentage of Sell ratings was 5.4% on March 31. For companies that generate less than 50% of sales inside the U.S., the aggregate percentage of Sell ratings was 6.4%. Thus, the difference in the percentage of Sell ratings between these two groups of companies was about one percentage point.
In terms of their ratings, industry analysts became more pessimistic in their outlook for the Energy sector during the first quarter. This sector recorded the largest increases in the number of Hold ratings and Sell ratings of all 10 sectors during the quarter.
In terms of their target prices, however, industry analysts are still optimistic in their outlook for the Energy sector. This sector had the largest upside difference (+11.6%) between the bottom-up target price ($638.27) and the closing price ($565.76) for all 10 sectors as of March 31. In other words, based on an aggregation of their price targets, industry analysts are projecting that the Energy sector will see the largest price increase (+11.6%) of all 10 sectors over the next 12 months.
Why are industry analysts bullish on the prospects for this sector in terms of their price targets? The optimism does not appear to be based on current earnings and revenue growth expectations for the sector for 2015. In terms of earnings, the sector is predicted to report a decline of 55.8% in 2015, which is the largest estimated year-over-year decrease in earnings of all 10 sectors for 2015. In terms of revenue, the sector is predicted to report a decline of 29.2% in 2015, which is also the largest estimated year-over-year decrease in revenues of all 10 sectors for 2015.
Perhaps industry analysts believe the sector is undervalued. The current forward 12-month P/E ratio for the sector is 27.9. This forward P/E ratio is the highest forward P/E ratio of all 10 sectors. It is well above the forward 12-month P/E ratio for the S&P 500 (16.7) as a whole. The current forward P/E ratio for the Energy sector is also well above the 10-year average (12.1) for the sector. On a percentage basis, the forward 12-month P/E ratio for the Energy sector is 130% above the 10-year average (27.9 vs. 12.1). This is also the largest upside percentage difference between the current P/E ratio for a sector and the 10-year average for a sector for all 10 sectors.
Perhaps industry analysts believe the price of oil is expected to rise for the remainder of the year relative to current prices? The current mean target price for crude oil (WTI) for 2015, based on estimates submitted by 82 analysts, is $56.92. This estimate is about 17% above yesterday’s closing price for crude oil ($48.68).
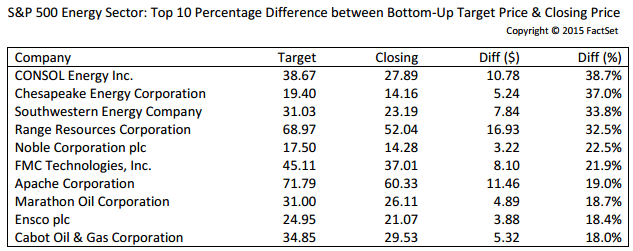
The table below lists the 10 companies in the Energy sector that had the largest upside differences between the mean target price and closing price as of March 31. CONSOL ENRGY (#5), Chesapeake Energy Corporation (#6), Southwestern Energy (#7), and Range Resources Corporation (#8) all ranked in the top 10 in the entire S&P 500 for largest upside differences between mean target price and closing price as of March 31.
Insight/Author%20Bios/JohnButters2.jpg)
Mr. John Butters is Vice President and Senior Earnings Analyst at FactSet. His weekly research report, “Earnings Insight,” provides analysis and commentary on trends in corporate earnings data for the S&P 500 including revisions to estimates, year-over-year growth, performance relative to expectations, and valuations. He is a widely used source for the media and has appeared on CNBC, Fox Business News, and the Business News Network. In addition, he has been cited by numerous print and online publications such as The Wall Street Journal, The Financial Times, The New York Times, MarketWatch, and Yahoo! Finance. Mr. Butters has over 15 years of experience in the financial services industry. Prior to FactSet in January 2011, he worked for more than 10 years at Thomson Reuters (Thomson Financial), most recently as Director of U.S. Earnings Research (2007-2010).

The Robotics Surge: Scale, Private Capital, and Competitive Moats
In this private capital analysis from FactSet, explore the factors accelerating robotics expansion and shaping competitive...
Gas Prices, Benefit Ratios, and Inflation
Stay ahead with FactSet’s weekly insights on the latest insurance industry updates, trends, events, and market developments.
Marine Insurance and Rising Gas Prices
This FactSet report provides an overview of marine insurance coverage for oil tankers and methods to analyze insurance sector...
Harnessing Thematic Momentum in Portfolio Rotation and Alpha Generation
Explore FactSet's latest research on thematic momentum rotation and considerations for investors to capitalize on dynamic trends....
The information contained in this article is not investment advice. FactSet does not endorse or recommend any investments and assumes no liability for any consequence relating directly or indirectly to any action or inaction taken based on the information contained in this article.
