

Aggregate dividend payments amounted to $105 billion at the end of the second quarter (July), which was a 10-year high for the S&P 500. This was the ninth consecutive quarter that dividends increased and the fifth consecutive quarter that dividend payments hit a new high. On a trailing twelve-month basis, the aggregate amount of dividends paid out was $399.3 billion. This was the sixth consecutive quarter that the index hit a 10-year high. At the end of Q2, dividend payments were nearly 45% greater than the 10-year TTM average of $274.5 billion.
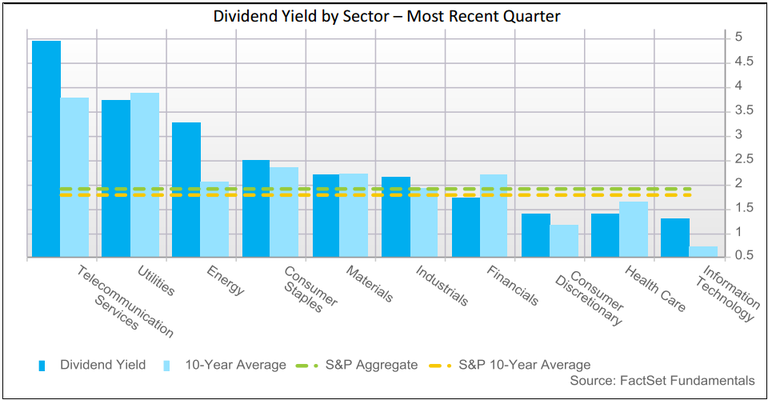
At the sector level, the aggregate dividend payments of all sectors exceeded their 10-year averages. The Financials and Information Technology sectors led all groups in terms of aggregate dividend payouts. The Financials sector ended the second quarter with dividend payouts totaling $67.7 billion, while the Information Technology sector saw dividend payouts of $59.6 billion. Four out of the top 10 companies ranked by TTM dividends paid were in these two sectors (AAPL, MSFT, WFC, and JPM).
Apple and Microsoft were the top two companies in terms of TTM dividends from the Information Technology sector. Apple distributed $3.1 billion in dividends in the second quarter and $11.4 billion over the trailing 12 months. The company also increased its dividend 11% to $0.52 per share at the end of April.
Microsoft was third on the top-10 list ranked by dividends paid, as the company distributed $2.5 billion in dividends in Q2 and $9.9 billion in the TTM. Wells Fargo and J.P. Morgan were the only two banks to make the list. Back in March, both companies were granted approval by the Federal Reserve under the Comprehensive Capital Annual Review (“CCAR”) to move ahead with their proposed investor payouts. Wells Fargo increased its quarterly dividend 7% to $0.37 per share and paid out $2.2 billion in dividends during the second quarter (TTM: $8.6 billion), while J.P. Morgan raised its dividend 10% to $0.44 per share and paid out $2 billion in dividends in Q2 (TTM: $7.4 billion).
Energy giants Exxon Mobil and Chevron remained two of the top 10 dividend payers, despite slowing sales and cuts to capital expenditures. In fact, Exxon topped the list, paying out over $11.8 billion in dividends in the TTM (CapEx cuts in the S&P 500 were discussed extensively in the latest Cash and Investment report). Exxon raised its quarterly dividend by 6% back in May, while Chevron maintained its dividend in Q2, despite a large miss on earnings. On its second quarter earnings call, Chevron Chief Financial Officer and Vice President Patricia E. Yarrington stated, “We made a commitment to investors in March. We said we would cover the dividend from free cash flow in 2017. We stand by that commitment.”
On a per-share basis, the trailing 12-month dividend payout was $40.52, which represented 11.3% growth year-over-year. At the sector level, all 10 sectors saw positive year-over-year DPS growth on a trailing twelve-month basis, with five groups experiencing double-digit growth.
The Consumer Discretionary sector led all groups in year-over-year growth, posting a 21.3% increase, while the Financials sector came in second with a 17.3% gain. The top contributors to growth in the Consumer Discretionary sector included Disney, General Motors, and Dollar General.
Disney, which has historically only paid an annual dividend, paid out a semi-annual dividend of $0.66 per share at the end of July. This was after the media and entertainment company had already boosted its annual dividend by 15%. General Motors was another contributor to year-over-year growth. The automotive company raised its quarterly dividend by 20% to $0.36 per share in Q2, after it re-initiated its dividend back in March 2014. Dollar General initiated a quarterly dividend of $0.22 per share, which also contributed to growth.
In the Financials sector, Crown Castle Entertainment was the major contributor to growth in TTM dividends. The real estate investment trust maintained its quarterly dividend of $0.82 in Q2, after increasing it by 134% at the end of 2014. Some of the major banks also increased their dividends in the trailing 12 months ending in Q2, such as Morgan Stanley, Goldman Sachs, Citigroup, BB&T, and Regions to name a few.
Looking at dividends per share over the next 12 months, analysts are projecting that DPS growth for the S&P 500 will slow to 7.6%. Eight out of the 10 GICS sectors are forecasted to see slower growth in DPS relative to the TTM period ending July 2015. The only two sectors with expected increases to growth rates are the Information Technology (+2% difference) and Consumer Staples (+0.8% difference) sectors. The Consumer Discretionary sector is estimated to face the largest decline, slowing to an 8.6% DPS rate year-over-year, compared to a TTM rate of 21.3%. The Financials sector will face the second largest decline, as it is projected to slow to 9.7% over the NTM from a TTM rate of 17.3%. That being said, in absolute terms, the Consumer Discretionary and Financials sectors still lead all other groups in terms of NTM dividends per share growth.
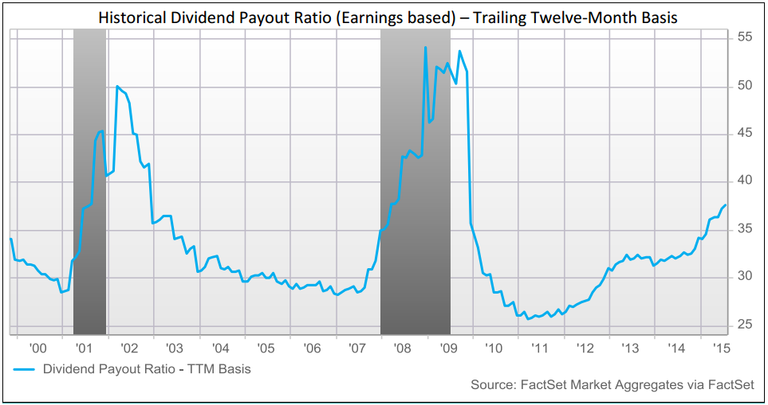
The S&P 500 TTM aggregate payout ratio increased for the sixth consecutive quarter in Q2 and reached its highest level (37.6%) since December 2009. The Q2 level was 6.7 percentage points above the index’s 10-year monthly median ratio. The dividend payout ratio has been rising due to trailing 12-month dividends growing at a faster pace than earnings. Looking forward, this trend may continue as analysts are projecting larger growth rates for dividends per share than they are projecting for earnings per share over the next 12 months.
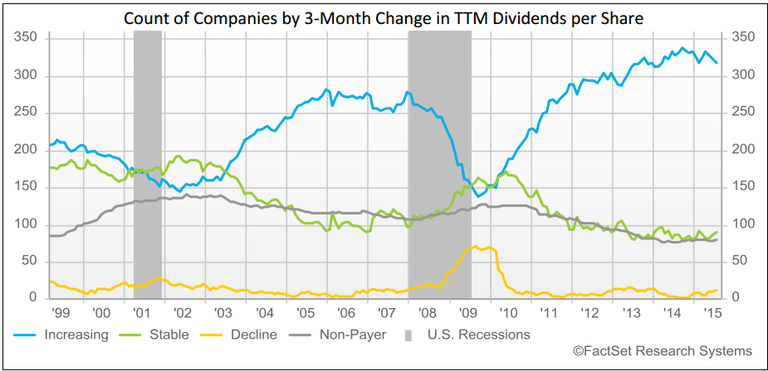
The number of companies in the S&P 500 paying a dividend at the end of the second quarter was 418. This was down from the trailing 12 months ending in April 2015, when the number of dividend payers was 420. The count of companies that have increased their dividend has declined as well. In the TTM ending in Q2, 316 companies increased their dividend from the TTM ending the prior quarter. In Q1 2015, the count of firms increasing their dividends stood at 331. The Energy sector had six fewer companies that increased their TTM dividends from the previous quarter, which was the largest amount of any other sector. The Industrials sector had four fewer companies increase their dividends.
Companies in the S&P 500 that have increased their TTM dividends per share from the three months prior consistently outperformed those companies that have maintained stable dividend payouts, as well as companies that have decreased their TTM dividends per share. The companies increasing their dividends have seen a market cap weighted cumulative return of 43.3% relative to the S&P 500 Total Return index (benchmark) since July 1995.
Non-dividend paying stocks have outperformed dividend paying stocks on a market cap weighted cumulative return basis relative to the S&P 500 Total Return Index since August 2013. Non-dividend payers have also outperformed the benchmark index in the last four consecutive months from July 2015.
As of the end of July, non-dividend payers saw an excess weighted cumulative return of 31.6% relative to the benchmark, while dividend payers saw a return of -49.90% relative to the benchmark. On an equal-weighted basis, non-dividend paying stocks have averaged a monthly return of 0.86% since July 1995, while dividend paying stocks averaged a monthly return of 0.82%. Additionally, our backtest showed that the group of dividend paying stocks outperformed the S&P 500 Total Return index in approximately 66% of the months when the index experienced negative returns. However, when the benchmark experienced positive returns, dividend payers outperformed the index in only 33% of the months.

Market Is Punishing Negative EPS Surprises More Than Average for Q1
FactSet earnings report: Explore the Q1 EPS trends among the companies in the S&P 500 that have reported results, including price...
S&P 500 Earnings Season Update: May 8, 2026
Our FactSet earnings report summarizes Q1 results for the 89% of companies in the S&P 500 that have reported. Explore EPS,...
Analysts Making Largest Increases in Quarterly EPS Estimates for S&P 500 in 5 Years
Stay updated on the S&P 500 Q1 earnings landscape in this quantitative analysis from FactSet. We highlight April and historical...
Three “Magnificent 7” Companies Push S&P 500 Earnings Growth to Highest Level Since 2021
Explore the impact of Mag 7 Q1 earnings growth in this FactSet S&P 500 earnings analysis.
The information contained in this article is not investment advice. FactSet does not endorse or recommend any investments and assumes no liability for any consequence relating directly or indirectly to any action or inaction taken based on the information contained in this article.

