

Companies in the S&P 500 spent $156 billion on share buybacks during the third quarter. This represented a 16% boost in spending from the second quarter and a 6.4% increase from the year-ago quarter. The total dollar-value share repurchases in Q3 marked the fourth highest amount since the start of 2005 and the second highest post-recession total. The count of companies participating in buybacks during the quarter increased to 383 from 380 in the second quarter.
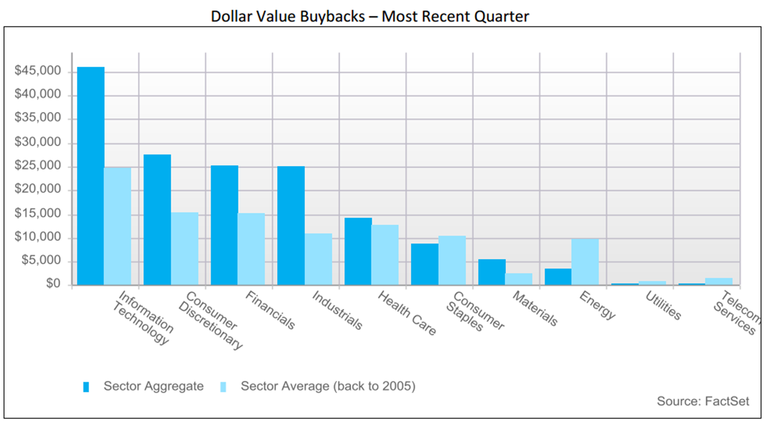
The Information Technology sector spent $45.9 billion on share buybacks during the third quarter, which was more than any other group. Four out of the top ten companies ranked by quarterly dollar-value buybacks were in this sector, with Apple and Microsoft leading the way.
As mentioned, Apple and Microsoft spent more on buybacks than any other company in the S&P 500 during the third quarter. Apple bought back $15.3 billion worth of its own shares in Q3, with $14 billion coming from open market repurchases. This contributed to a net reduction in shares outstanding of 2.2% compared to the end of the second quarter, and a 4.9% reduction compared to the year-ago quarter. As of Friday’s close, the iPhone maker’s stock price is up 3.1% in the past year on a total return basis. Microsoft was the second largest spender on buybacks in Q3. The software company repurchased $4 billion worth of shares during the quarter as part of its $40 billion buyback program, which was announced in September 2013. Microsoft bought back its shares during the quarter at an average price of $44.70, which was a 0.4% discount to its average daily stock price for the quarter. The stock is up 17.7% in the past year on a total return basis.
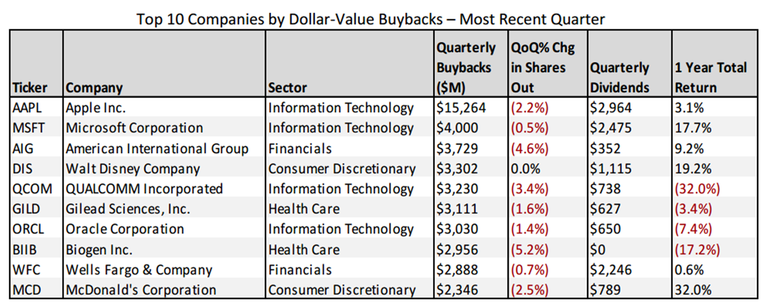
Two newcomers to the top ten list of buyback spenders were Walt Disney and McDonald’s. Both are part of the Consumer Discretionary sector, which was the third largest spending sector in Q3. Disney repurchased $3.3 billion worth of shares during the quarter, which was its largest quarterly amount in ten years. The media and entertainment enterprise had a rough August, as the company saw its stock price plunge over 15% amid concerns that a growing group of consumers are willing to do without traditional cable subscriptions. Disney management saw this as a buying opportunity and increased its repurchases for the quarter. Its stock has since bounced back, and is up 9.3% since the beginning of September, and 19.2% in the past year on a total return basis. McDonald’s repurchased $2.3 billion worth of stock during the quarter, which was its largest quarterly amount in ten years. This contributed to a 2.5% reduction in share outstanding from the previous quarter. The fast food chain also announced a plan to increase its total distributions to shareholders by $10 billion through the end of 2016. As a result, Standard & Poor’s downgraded the company’s corporate credit rating from A- to BBB+ due to an increased debt burden from financing its distributions.
The Industrials sector led all major buyback sectors (excluding the Telecom and Utilities sectors, which have each averaged less than $2 billion in quarterly buybacks since 2005) in terms of year-over-year growth (+46.2%). The Financials sector came in second with a growth rate of 27%. Four out of the eight buyback groups posted positive year-over-year growth in Q3, with the Industrials, Financials, and Information Technology sectors each achieving double-digit growth.
Honeywell International and American Airlines were two of the major drivers of growth in the Industrial sector. Dollar-value buybacks for Honeywell amounted to $1.2 billion in Q3, compared to $138 million in the year ago quarter. American Airlines repurchased $1.6 billion worth of stock during the quarter versus $132 million in Q3 2014. The company doubled its repurchase program to $4 billion back in July, amid growing earnings due to lower oil prices and a depressed stock price. The attractive price-to-earnings valuation allowed the airline to purchase its own shares in Q3 at a 1.2% discount relative to the average price for the quarter, and a 6% discount over the trailing twelve months relative to the average price for the same period. Additionally, American Airlines authorized a new $2 billion repurchase program in October, which is slated to be completed by the end of 2016.
American International Group and Citigroup were the top contributors to year-over-year buyback growth in the Financials sector for the second consecutive quarter. AIG repurchased $3.7 billion worth of stock during the third quarter, which was a $2.4 billion increase from the year ago quarter. This contributed to the 11.2% reduction in its common shares outstanding year-over-year. Citigroup bought back nearly $2 billion worth of its own shares, which was a $1.8 billion increase from Q3 2014.
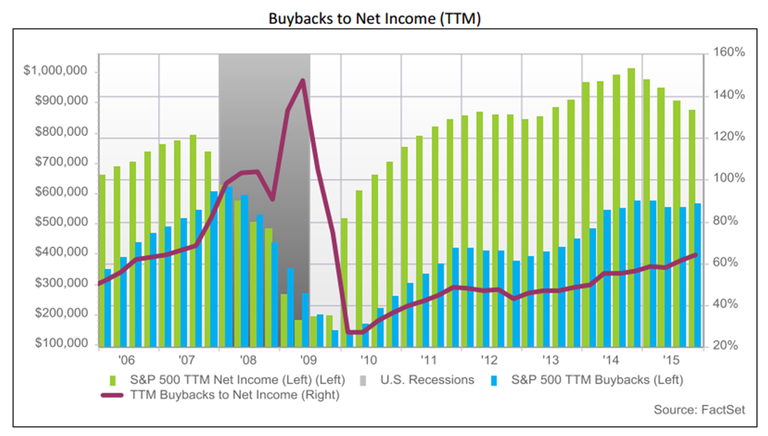
The dollar amount spent on share buybacks for the trailing twelve months ending in Q3 represented 64.6% of net income. This marked the largest percentage since October 2009, when buybacks made up 74.8% of net income. S&P 500 buyback levels are hovering near their post-recession highs, which is contributing to this rising ratio. The other factor affecting the ratio has been depressed earnings. As mentioned in the FactSet Research Desk’s Earnings Insight report, Q3 2015 marked the first back-toback quarters of earnings declines since 2009. The dollar of value of buybacks actually decreased by 1.1% YoY on a TTM basis, but the decline in earnings helped to boost the ratio to 64.6% from 56.5% in Q3 2014. This earnings decline is expected to continue, as analysts are not projecting earnings growth for the S&P 500 index to return until the first quarter of 2016. This trend could push the ratio even higher over the next three months.
The number of companies that are spending more on buybacks than they generate in net income also hit its highest number since January 2009. In the trailing twelve months ending in Q3, 130 companies had a buyback to net income ratio that exceeded 100%. The bulk of these companies were concentrated in the Information Technology (28), Consumer Discretionary (24), and Energy (20) sectors.
While the TTM buybacks to earnings ratio grew in the third quarter, the buybacks to free cash flow ratio declined 14.4% from the second quarter to 90.7%. The decline was due to the quarter-over-quarter increases in both TTM dollar value buybacks and free cash flow. Free cash flow grew 19% in Q3 as a result of increases to operating cash flow and decreases to capital expenditures.
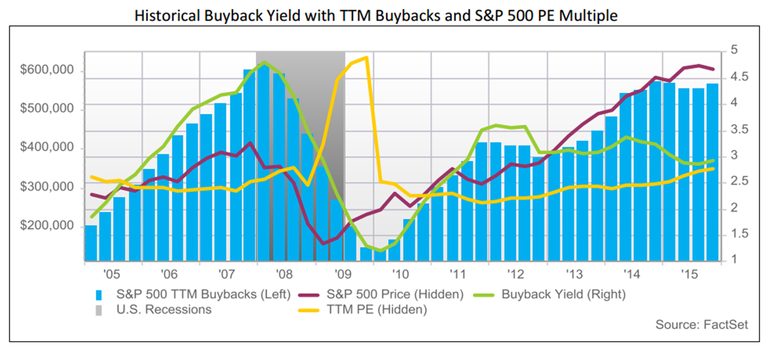
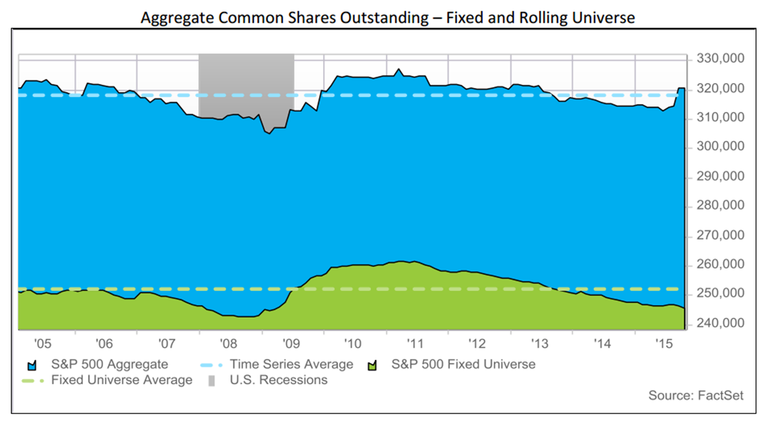
The buyback yield for the S&P 500 remained at a low level at the end of Q3. The trailing twelve months shares repurchased represented 2.93% of the aggregate shares outstanding in the index, which was 4.1% below the quarterly average going back to 2005. Despite dollar value buybacks not being far off their post-recession highs, the number of shares repurchased over the TTM was still 4.1% below the time series average (back to 2005) by the end of Q3. Price levels and valuations have been rising overall, making it more expensive to repurchase shares, and consequently depressing the buyback yield. Another factor contributing to this low buyback yield was the increase in common shares outstanding both on a QoQ and YoY basis.
Relative to shares outstanding, the Information Technology sector was the most active buyer of its own shares in Q3 (similar to Q2). The sector’s trailing twelve-month share repurchases amounted to 4.5% of the sector’s aggregate shares outstanding over the period. Motorola Solutions had the highest buyback yield, as it repurchased 38.1% of its shares outstanding. This contributed to a year-over-year share reduction of 26.6%. Quanta Services had the second largest buyback yield and repurchased 35.3% of its shares, which contributed to a 25% reduction in share count year-over-year.
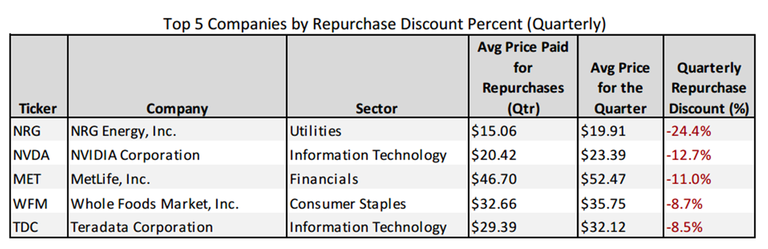
In an effort to find companies that have repurchased shares during periods of depressed prices, this report examines companies’ average price paid for repurchases over the quarter and the trailing twelve months, and compares that to their average stock price over the same period.** Based on this analysis, NRG Energy and NVIDIA Corporation bought back their shares at the largest discount in the most recent quarter (24.4% discount and 12.7% discount). Expedia and Micron Technology repurchased their shares at the largest discount in the trailing twelve months ending in the most recent quarter (29.7% discount and 28.4% discount).
To research the effect of share repurchase program announcements on short-term prices in the most recent quarter, this analysis uses StreetAccount to track the timeline of these company announcements. The universe of this analysis is S&P 500 companies that have announced new share repurchase programs during the quarter.*** The average price change for these companies from two days prior to the announcement date to two days after was -.23%. The average price change from one day prior to one day after was -.38%. Companies will sometimes disclose their new buyback programs in their earnings releases. This could potentially sway the data as the stock price could represent a reaction to the overall quality of earnings for the quarter rather than the repurchases. To isolate the effect of repurchase announcements, the following analysis tracked companies in the S&P 500 that announced new repurchase programs during Q3 while excluding those that did this on the same day as their earnings release date. These results stayed consistent with the earlier findings. On average, the companies’ prices dropped by -.29% using a two day interval relative to the announcement date, and -.75% using a one day interval.
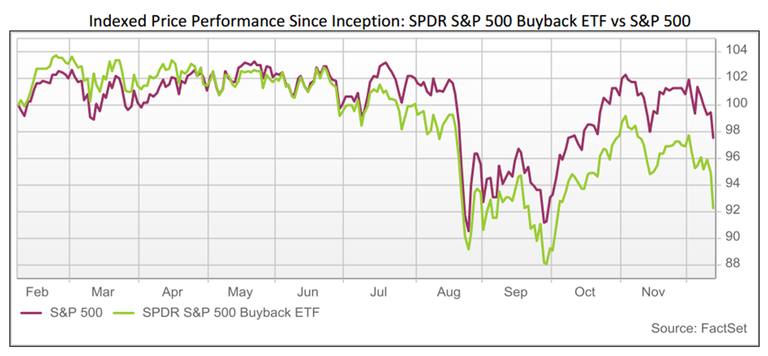
To determine the longer term price performance of buyback spenders, the SPDR S&P 500 Buyback ETF (SPYB) and the PowerShares Buyback Achievers Portfolio (PKW) can be used. These are two of the most well-known exchange traded funds for investors looking for exposure exclusively to companies repurchasing shares. The SPYB tracks the S&P 500 Buyback Index, which provides exposure to the 100 constituents of the S&P 500 with the highest buyback ratio in the TTM. The ETF debuted on 2/5/2015 and is down 7.7% since inception (as of Friday’s close). It declined 1.3% in Q2 (May-July) and 10.8% in Q3 (Aug-Oct). The PKW tracks the NASDAQ U.S. Buyback Achievers Index, which is comprised of U.S. securities issued by corporations that effected a net reduction in shares outstanding of 5% or more in the TTM. The ETF has outperformed the S&P 500 over the past five years on a cumulative basis. However, PKW has declined 5.3% year to date as of the close on Friday, despite dollar value buybacks being at some of their highest levels on record. This trails the price performance of the S&P 500 index, which is down 2.3% this year as of Friday’s close. Keep in mind that these ETFs usually will not capture any short term price movements after the announcement date since they look at net share reduction (for PKW) and buyback ratio (SPYB) for the trailing twelve months.

More Than 65% of S&P 500 Earnings Calls for Q4 Cited “AI”
Stay updated on the S&P 500 with this earnings insight from FactSet, featuring analysis of AI mentions at the aggregate and...
Number of S&P 500 Earnings Calls Citing “Tariffs” Declined for 3rd Straight Quarter
Stay updated on the S&P 500 with FactSet. This report summarizes tariff mentions during earnings calls the past three months at...
Earnings Insight Infographic: Q4 2025 By the Numbers
Get a quick look back at S&P 500 aggregate performance with these key highlights of the fourth quarter 2025 earnings season from...
Analysts Lowering Quarterly EPS Estimates for First Time Since Q2 2025
In this FactSet earnings report, read our quantitative analysis of current EPS against historical averages for the S&P 500,...
The information contained in this article is not investment advice. FactSet does not endorse or recommend any investments and assumes no liability for any consequence relating directly or indirectly to any action or inaction taken based on the information contained in this article.

