

The S&P 500 (ex-Financials) cash and short-term investments balance amounted to $1.45 trillion in the third quarter, which was the second highest level in 10 years. This amount reflected 5.8% growth on a year-over-year basis and 0.95% growth quarter-over-quarter. Seven out of nine sectors posted positive year-over-year growth, with the Consumer Staples (-2.3%) and Energy (-7.5%) sectors being the only decliners.
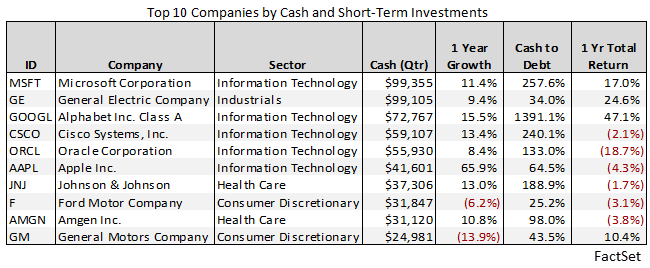
The Information Technology sector had the largest cash balance ($566.7 billion) at the end of Q3, which has been the norm over the past 10 years. The top five companies ranked by quarterly cash in this sector were Microsoft ($99.4 billion), Alphabet ($72.8 billion), Cisco Systems ($59.1 billion), Oracle ($55.9 billion), and Apple ($41.6 billion).
Fixed capital expenditures totaled $157.1 billion in Q3, which represented a 4.7% decrease from the year-ago period. The third quarter was the second consecutive quarter that capital spending in the S&P 500 (ex-Financials) declined on a year-over-year basis.
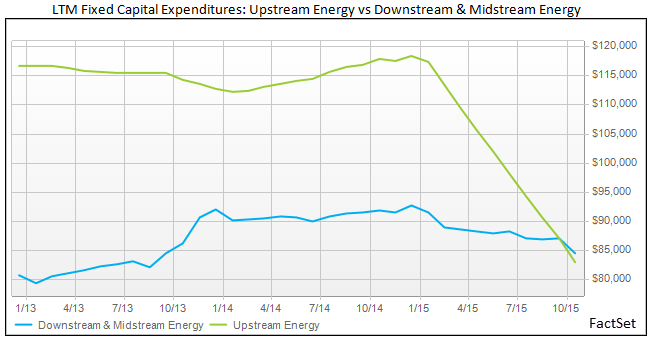
At the sector level, the Energy, Consumer Staples, and Information Technology groups experienced CapEx decreases in Q3 on a year-over-year basis. The Energy sector once again led the decline and saw a YoY decrease in fixed capital expenditures of 33.3%, which was even steeper than the decrease in Q2. On a quarter-over-quarter basis, fixed capital expenditures fell 7.4% in the Energy sector. With oil prices down 32.3% year-to-date, energy companies have been forced to cut capital expenditures in order to preserve cash. In the third quarter, ConocoPhillips and Apache cut CapEx by over $2 billion compared to the year-ago quarter, while Exxon, Occidental Petroleum, and Chevron decreased spending by over $1 billion. By the end of Q3, the Energy sector made up 22.8% of CapEx for the S&P 500 (ex-Financials), which was 2.7 percentage points less than the weight in Q2. It is interesting to note that the larger cuts to fixed capital expenditures have come from companies classified as Upstream Energy. The classification is based on The Revere Business Industry Classification System (RBICS). Firms classified as Downstream or Midstream Energy by RBICS, such as Marathon Petroleum or Columbia Pipelines, have generally seen less severe cuts to capital spending. On a trailing 12-month basis, Upstream companies in the S&P 500 Energy sector saw a 29.6% YoY decline in fixed CapEx, while Downstream and Midstream companies only saw an 8% decline.
On the other end of the spectrum, the Consumer Discretionary sector posted the largest year-over-year growth in fixed capital expenditures in Q3 (+23.5%). The third quarter marked the twelfth consecutive quarter that the Consumer Discretionary sector has experienced positive YoY growth in CapEx. General Motors was the largest contributor, as it more than doubled its capital spending from the year-ago quarter to $6.4 billion in total. Two media companies, Comcast and Disney, were additional contributors (+$238 million and +$141 million).
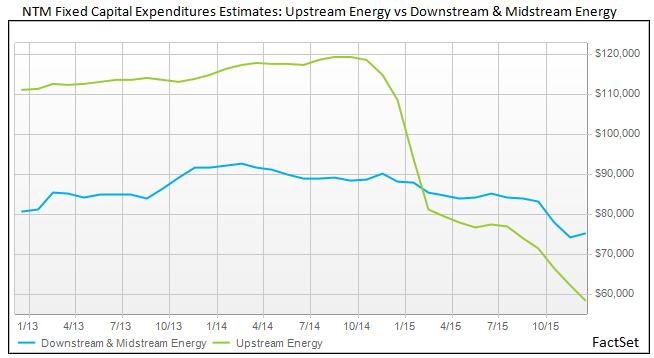
In the next 12 months, analysts are predicting year-over-year declines in CapEx for the Energy sector and the index as a whole. As of Friday’s close, the Energy, Materials, Industrials, Utilities, and Consumer Staples sectors are estimated to see cuts to fixed capital expenditures over the next twelve months. The Health Care sector is forecasted to have the highest growth rate of any other group (+6.6%), while the downward trend in the Energy sector is expected to continue. CapEx in the Energy sector is estimated to decline 15.7% in the NTM, with Upstream Energy companies decreasing 23.1%, and Downstream and Midstream Energy companies falling 8.4%.
Companies in the S&P 500 (ex-Financials) generated $357.2 billion in operating cash flow (OCF) in Q3, which represented a year-over-year decline of 3.4%. The decline was deceiving given the high water mark set in October 2014, which was the third largest OCF total in 10 years ($369.8 billion). On a sequential basis, Q3 operating cash flow grew 6.3%, and was only 10.7% off the index’s 10 year high. With the exception of the Energy sector, each group posted quarterly operating cash flow that was greater than its 10-year average. After subtracting fixed capital expenditures, aggregate free cash flow amounted to $201.3 billion, which reflected a 1.9% decline YoY. The Q3 free cash flow total was the fifth largest amount in 10 years.
At the sector level, five of the nine sectors showed YoY increases in operating cash flow (Consumer Discretionary, Health Care, Materials, Telecom, and Utilities). The Consumer Discretionary sector led the way, posting YoY growth of 22.5%. On the other hand, the Energy, Consumer Staples, Industrials, and Information Technology groups experienced declines, with the Energy sector seeing a 35.6% decline in operating cash flows. Similar to Q2, the macro headwinds for the Energy sector have dampened revenue. Aggregate quarterly revenue for the sector dropped more than 37% year-over-year in Q3. The Energy group has been the worst performing sector in 2015, and is down 25.3% year-to-date, as of Friday’s close.
While the Energy sector has struggled, the Consumer Discretionary sector has flourished. Aggregate quarterly revenue increased 8.8% from the year ago quarter, which helped push operating cash flow to the sector’s second highest total in 10 years. The Consumer Discretionary group grew fixed CapEx by more than any other sector in Q3, while also increasing free cash flow by 21.3% year-over-year. The Consumer Discretionary sector has been the best performing sector in 2015, and is up 7.4% year-to-date, as of Friday’s close.
As mentioned above, companies in the S&P 500 (ex-Financials) decreased their spending on fixed assets in Q3 compared to the year ago quarter. However, these companies invested their capital in other areas. The amount of capital spent on research and development amounted to 56.2 billion in Q3 and $257.8 billion over the trailing 12 months. Both numbers represented 10-year highs for the S&P 500 (ex-Financials) index. Aside from the Telecom group, all sectors spent more on research and development in Q3 than their 10-year averages. The Information Technology ($112.7) and Healthcare ($68.7) sectors dominated all other groups in terms of R&D spending, with nine out of the top 10 companies ranked by R&D expenses coming from these two sectors. This makes sense as these two groups consistently had the largest cash balances, and companies in these sectors continuously innovate in order to stay ahead of their competitors. Microsoft ($11.9 billion), Intel ($11.9 billion), and Alphabet ($11.6 billion) were the top three spenders on R&D in the TTM ending in Q3. Amazon was the only company outside of the Information Technology and Healthcare groups that was on the top 10 list.
The amount of cash spent on assets acquired from acquisitions was $127.9 billion, which was a 10-year high for the index and more than double the 10-year average. The spending in Q3 was concentrated in the Healthcare ($54.4 billion), Industrials ($22.6 billion), and Consumer Staples ($20.3 billion) sectors. Spending on assets acquired from acquisitions in these three sectors made up 76% of the total spending in the S&P 500 (ex-Financials). Some of the big spenders in these sectors were: Pfizer, United Health, Danaher, 3M, CVS Health, and Kraft Heinz.
Looking at other investing activities, cash flows from the sale of business assets declined 10.5% from the year ago period to $23.7 billion. NiSource and Mondelez International were at the top of the list for cash inflows from business divestitures, as the companies sold off $3.8 billion and $3.7 billion worth of assets, respectively. Companies in the S&P 500 (ex-Financials) sold more investment securities than they purchased for the first time since January 2014. Cash inflows from the net sale of investment securities amounted to $5 billion in Q3, while the 10-year average was $19.3 billion in cash outflows from the net purchases of investment securities.
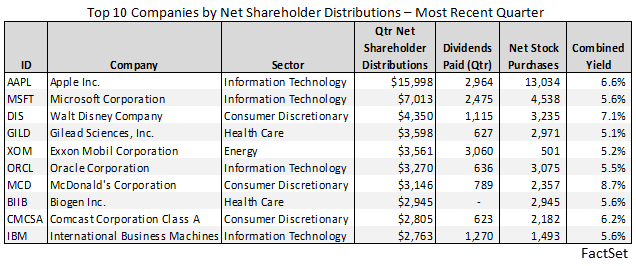
Quarterly net shareholder distributions, which are calculated by adding dividend payments and net purchases of stock, amounted to $196.3 billion in Q3. This represented a 2.9% increase year-over-year and an 11.8% increase quarter-over-quarter. The third quarter total was the largest amount of net shareholder distributions for the S&P 500 (ex-Financials) in at least 10 years. This was driven by record levels of dividend payments and growing dollar-value share repurchases in Q3, which are discussed in further detail in last week's Dividend Quarterly and Buyback Quarterly reports. At the company level, firms in the Information Technology and Consumer Discretionary sectors dominated the top 10 list ranked by quarterly net shareholder distributions, with Apple and Microsoft leading the way.
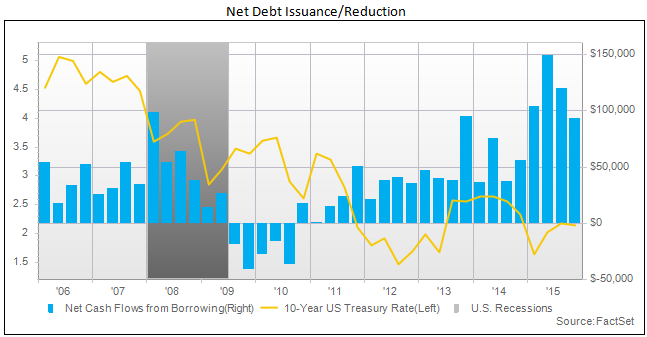
On the debt financing side, cash inflows from net debt issuance were positive for the 21st consecutive quarter. That being said, net debt issuance slowed to $93.2 billion in Q3, which was nearly 30% lower than the amount in Q2. As shown below, companies have been taking advantage of near zero interest rates by increasing their rate of borrowing. With the Federal Reserve raising interest rates for the first time since 2006 last week, it will be interesting to see if companies continue to issue debt to fund activities such as buybacks and dividends.

More Than 65% of S&P 500 Earnings Calls for Q4 Cited “AI”
Stay updated on the S&P 500 with this earnings insight from FactSet, featuring analysis of AI mentions at the aggregate and...
Number of S&P 500 Earnings Calls Citing “Tariffs” Declined for 3rd Straight Quarter
Stay updated on the S&P 500 with FactSet. This report summarizes tariff mentions during earnings calls the past three months at...
Earnings Insight Infographic: Q4 2025 By the Numbers
Get a quick look back at S&P 500 aggregate performance with these key highlights of the fourth quarter 2025 earnings season from...
Analysts Lowering Quarterly EPS Estimates for First Time Since Q2 2025
In this FactSet earnings report, read our quantitative analysis of current EPS against historical averages for the S&P 500,...
The information contained in this article is not investment advice. FactSet does not endorse or recommend any investments and assumes no liability for any consequence relating directly or indirectly to any action or inaction taken based on the information contained in this article.

