

Shareholder distributions, defined as total dividends plus gross share buybacks, amounted to $259.8 billion at the end of the third quarter (October). This was the highest quarterly total of shareholder distributions in at least 10 years. The second highest total occurred in April 2014, when distributions amounted to $252.2 billion. In general, both dividends and gross share buybacks have been growing coming out of the recession.
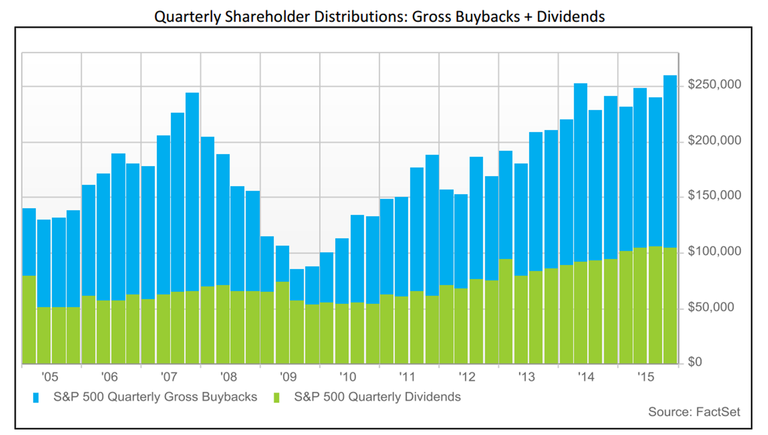
Aggregate dividend payments made up 40% of total shareholder distributions. Dividend payments amounted to $103.3 billion in Q3, which was the third largest quarterly total in at least 10 years. This was a 1.6% decline from the Q2 amount (largest total in at least 10 years), but a 10.9% increase on a year-over-year basis. The total dividend payout for the trailing 12 months ending in Q3 was $410.8 billion, which marked the largest TTM payout in at least 10 years. The third quarter also marked the seventh consecutive quarter that the index hit a new high.
At the sector level, the Financials and Information Technology sectors led all groups in term of aggregate dividend payouts (similar to Q2). The Financials sector ended Q3 with dividend payments totaling $17.5 billion on a quarterly basis and $70 billion on a trailing 12-month basis. The Information Technology sector paid out $14.6 billion in quarterly dividends and $60.9 billion in TTM dividends. Similar to Q2, four out of the top 10 companies ranked by TTM dividends paid were in these two sectors (AAPL, MSFT, WFC, and JPM). Microsoft and Verizon were the only two companies on the list to raise their dividends during the third quarter. Microsoft announced an increase to its quarterly dividend from $0.31 to $0.36 in mid-September. Verizon raised its quarterly dividend by 2.7% to $0.565, which marked the ninth consecutive year that the wireless communications company increased its quarterly dividend.
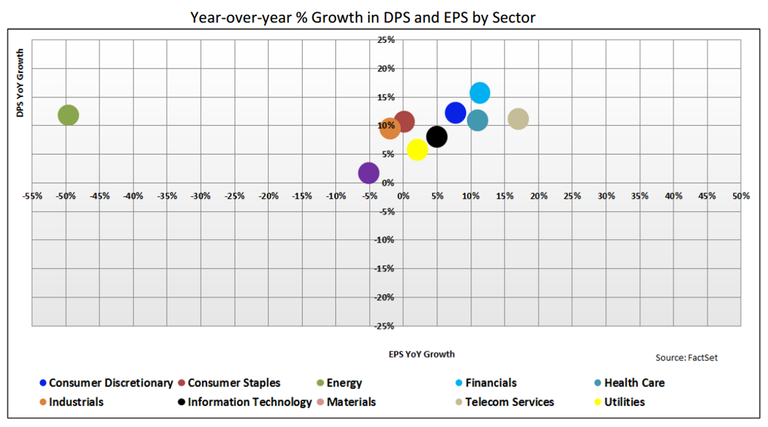
Dividends per share for the S&P 500 hit one of its highest levels in 10 years during the third quarter. Still, the year-over-year growth in DPS was the lowest rate seen since 2011. The TTM DPS ending in Q3 was $42.36, which represented 10.9% growth from the year-ago period. Although the Q3 growth rate was below the average YoY growth rate for the past eight quarters (12.1%), the S&P 500 DPS has still increased at double-digit rates going back to Q4 2010. At the sector level, all 10 sectors posted positive year-over-year growth for the TTM ending in Q3, and six sectors posted double-digit growth rates (Financials, Healthcare, Consumer Discretionary, Consumer Staples, Energy, and Telecom). The Financials sector led all groups in YoY DPS growth posting a 15.8% increase. Citigroup, Bank of America, Crown Castle International, and Intercontinental Exchange were several of the largest contributors to growth in this sector. The Healthcare sector came in second with a 13.2% growth rate. Top contributors to growth in this sector came from Universal Health Services, Anthem, UnitedHealth, Amgen, and AmerisourceBergen.
TTM dividends per share growth for the S&P 500 slowed in Q3, and the same is projected for the next 12 months. Looking at dividends per share over the NTM, analysts are projecting that DPS growth for the index will slow to 6.5%. Nine out of the 10 GICS sectors are forecasted to see slower growth in DPS relative to the TTM period ending October 2015. The only sector expected to experience an accelerated growth rate in dividends per share is the Information Technology sector (+0.2%). The Energy sector is estimated to face the largest decline in growth, slowing to a 3.5% DPS rate YoY, compared to a TTM rate of 11.8%. Income investors exposed to the Energy sector may want to keep an eye on this trend going forward. If commodity prices continue to fall, more energy companies could start to cut or suspend shareholder distributions to save cash. In the TTM ending in Q3, five companies in the sector lowered their dividend payouts compared to the TTM period a quarter ago. In absolute terms, the Financials and Healthcare sectors are still projected to lead all other groups in terms of NTM dividends per share growth.
The S&P 500 TTM payout ratio was 37.02% in Q3, which represented a 20.7% premium to the 10-year median ratio. This was a slight decline from the Q2 value (37.6%), which was the highest level reached since 2009. Going forward, earnings per share growth over the NTM is expected to outpace dividends per share growth, which may push the payout ratio lower. This is a reversal from the end of Q2, when DPS growth was expected to exceed EPS growth. Additionally, the S&P 500 TTM dividend yield in Q3 was 2.05%. This value represented a 4.1% premium to the index’s 10-year median yield.
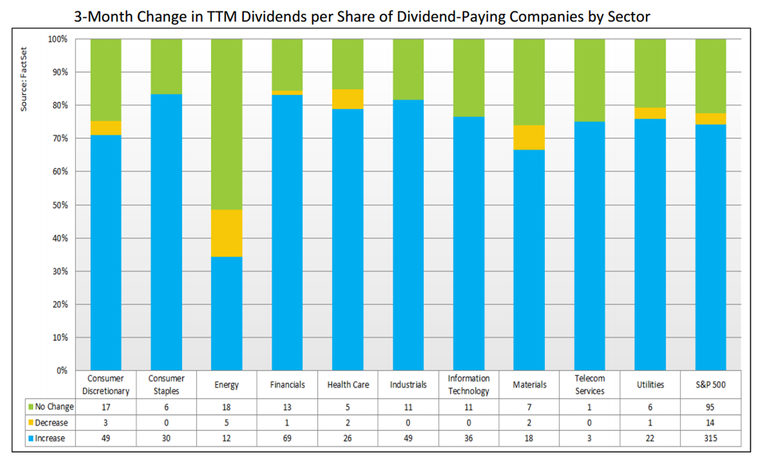
The number of companies in the S&P 500 paying a dividend in the trailing 12 months ending in Q3 was 424. This was an increase from the TTM period a quarter ago, when the number of dividend payers was 421. Additionally, the count of companies decreasing their dividends increased from 12 to 14. In general, a company rarely likes to cut or suspend its dividend payout, unless it is absolutely necessary, because management knows that the market will typically interpret it as a negative sign. The Energy sector contained the greatest number of companies that either cut their dividends or suspended them completely in the TTM ending in Q3 compared to Q2 (five companies). One of the most recent companies (in the Materials sector) to do so was Freeport-McMoRan. The world’s second largest copper miner decreased its quarterly dividend by 84% to $.05 per share back in March amid the impact faced from lower commodity prices. On December 9, it suspended its quarterly dividend of $.05 and announced it will be reducing capital spending and deferring investments in long term projects as a result of volatile oil and gas market conditions. As of Friday’s close, the company’s stock is down 70.1% year-to-date. Baxter International, Transocean, and Chesapeake Energy are several other companies that have also cut their dividends per share.
Since April 2013, dividend payers in the S&P 500 have underperformed non-dividend payers on a market-cap weighted cumulative return basis relative to the S&P 500 Total Return Index (benchmark). In the three months ending in Q3, the total return spread between the two groups has soared.
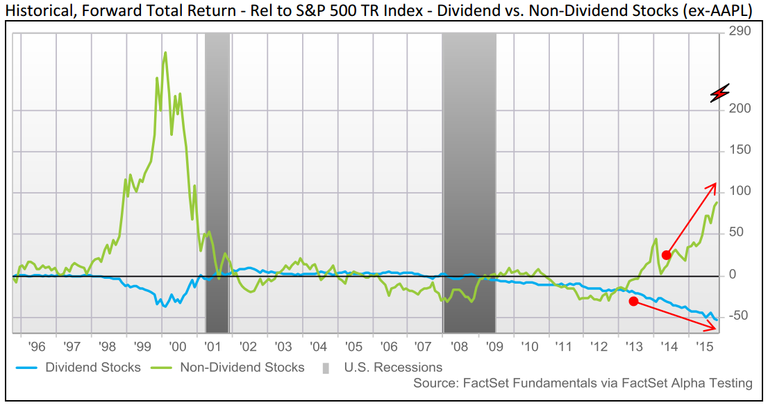
As of the end of October, dividend paying stocks saw an excess weighted cumulative return of -52.8% relative to the benchmark, while non dividend paying stocks saw a return of 88.3% relative to the benchmark. This return spread (141.1 percentage points) is the highest recorded since August 1999, when the spread was 149.8 percentage points. A contributor to this trend is the Energy sector. Energy stocks have been taking a hit recently with commodity prices slumping, and the majority of energy companies in the S&P 500 pay out a dividend. Some of the underperforming dividend payers have been CONSOL Energy, Williams Companies, Range Resources, Kinder Morgan, Chesapeake Energy, Cabot Oil & Gas, and Devon Energy. Contrastingly, some of the outperforming non-dividend payers have been Cameron International, First Solar, Priceline, Amazon, O’Reilly Automotive, Newfield Exploration, and VeriSign.

More Than 65% of S&P 500 Earnings Calls for Q4 Cited “AI”
Stay updated on the S&P 500 with this earnings insight from FactSet, featuring analysis of AI mentions at the aggregate and...
Number of S&P 500 Earnings Calls Citing “Tariffs” Declined for 3rd Straight Quarter
Stay updated on the S&P 500 with FactSet. This report summarizes tariff mentions during earnings calls the past three months at...
Earnings Insight Infographic: Q4 2025 By the Numbers
Get a quick look back at S&P 500 aggregate performance with these key highlights of the fourth quarter 2025 earnings season from...
Analysts Lowering Quarterly EPS Estimates for First Time Since Q2 2025
In this FactSet earnings report, read our quantitative analysis of current EPS against historical averages for the S&P 500,...
The information contained in this article is not investment advice. FactSet does not endorse or recommend any investments and assumes no liability for any consequence relating directly or indirectly to any action or inaction taken based on the information contained in this article.

