

Shareholder distributions, defined as total dividends plus gross share buybacks, amounted to $241 billion at the end of the fourth quarter (January 2016). This was the fifth highest quarterly total of shareholder distributions in at least 10 years.
Aggregate dividend payments made up 43% of total shareholder distributions in Q4. Quarterly dividends for the S&P 500 amounted to $104 billion, which was a 3.6% increase year-over-year and a 0.6% increase quarter-over-quarter. The dividend total in Q4 2015 represented the second largest quarterly dividend amount in at least 10 years. The total dividend payout for the trailing 12 months ending in Q4 was $415.4 billion, which marked the largest TTM payout in at least 10 years. To put this into perspective, the average TMM dividend payout in the past 10 years has been $281.6 billion. Therefore, the Q4 aggregate dividend amount was nearly 50% more than the 10-year average.
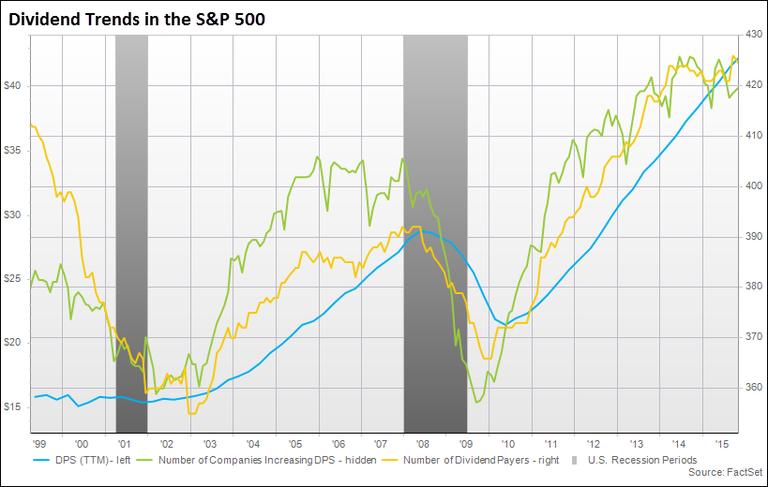
The fourth quarter also marked the eighth consecutive quarter that the TTM dividend payout for the index hit a new high. The number of dividend payers in the S&P 500 at the end of Q4 was 425 companies. This was a slight increase from the 424 companies paying dividends in the trailing 12 months one quarter ago.
At the sector level, the Financials and Information Technology sectors once again led all groups in term of aggregate dividend payouts (similar to Q3). The Financials sector ended Q4 with dividend payments totaling $18.1 billion on a quarterly basis and $72.3 billion on a trailing 12-month basis. The Information Technology sector paid out $16.6 billion in quarterly dividends and $59 billion in TTM dividends.
The Consumer Staples sector has also consistently been one of the top groups in terms of aggregate dividends paid. In the TTM ending in Q4, companies in the Consumer Staples sector paid out $55.3 billion worth of dividends, which made up about 13% of the total for the S&P 500. Several of the largest payers in the sector were Procter & Gamble, Wal-Mart, Philip Morris, and Coca-Cola. Each of these companies fell in the top 15 list of S&P 500 companies by TTM dividends paid.
Dividends per share for the S&P 500 amounted to $43.30 for the trailing 12 months ending in Q4, which represented the largest aggregate DPS in at least 10 years. The trend in recent years has been increasing dividends per share at decreasing growth rates. This continued in the fourth quarter. The year-over-year growth rate for the TTM DPS ending in Q4 slowed to 9.5%, which marked the first single digit growth rate since Q4 2011, when YoY growth was 5.7%. The average year-over-year growth rate for the past ten years was 8.4%. At the sector level, nine out of the 10 GICS sectors posted positive year-over-year growth for the TTM ending in Q4, and five sectors logged double-digit growth rates (Healthcare, Financials, Consumer Discretionary, Telecom, and Consumer Staples.) The Materials sector was the only group to see a decline in year-over-year dividends per share.
The Healthcare sector led all groups in YoY DPS, posting a 14.5% increase. The Financials sector came in second with a 14.4% growth rate. Within both of these groups, there were several companies that raised their quarterly dividends in Q4 relative to Q3. Agilent Technologies, Zoetis, and AbbVie, which are part of the Pharmaceuticals Biotech & Life Sciences GICS industry group, each increased their quarterly dividends compared to Q3. Assurant, Lincoln National, and Prudential Financial, which are part of the Insurance GICs industry group, also raised their dividends quarter-over-quarter.
The Energy sector was another standout group in terms of TTM dividends per share growth. In Q4, year-over-year growth for the sector slowed to only 2.4%, which was a significant drop from the 11.6% growth logged in Q3. Several of the major contributors were Diamond Offshore Drilling, Ensco plc, and Chesapeake Energy, which each saw their trailing 12 months dividends per share decline over 75% compared to a year ago.
TTM dividends per share for the S&P 500 slowed to a single-digit growth rate in Q4 and the same is projected for the next 12 months. Looking at dividends per share over the NTM, analysts are projecting that DPS growth for the index will decelerate to 5.5%. This represents a fairly sharp decline from the 9.5% DPS growth posted in Q4. With dividends per share for the index reaching its highest level in 10 years, analysts do not seem to think the pace of these payouts can be sustained.
A major reason for this sentiment can be attributed to the continued decline in aggregate earnings for S&P 500 companies. The blended year-over-year earnings decline for the index was -3.5% in Q4 2015. The fourth quarter marked the first time that the S&P 500 has seen three consecutive quarters of YoY earnings declines since Q1 2009 through Q3 2009. Analysts do not expect earnings growth to return until Q3 2016. Additional analysis on earnings trends can be found in our weekly Earnings Insight.
Looking at DPS at the sector level, nine of the 10 GICS sectors are forecasted to see slower growth over the next 12 months relative to the TTM period ending in January 2016. The only sector expected to experience an accelerated growth rate in dividends per share is the Material sector (+2.3%).
In terms of absolute growth in dividends per share over the next 12 months, the Financials and Healthcare sectors lead all groups with growth rates of 13.3% and 8.4%, respectively. On the other end of the spectrum, the Energy sector is the only group estimated to experience an actual decline in dividends per share in the next 12 months versus just a reduced growth rate. Analysts forecast that the sector will see an 8.9% drop in DPS in the NTM compared to the 2.7% growth it saw in the TTM. Once again, lower oil prices can be seen as one of the culprits driving this decline as oil prices fell 27.8% in Q4 (October 31, 2015-January 31, 2016).
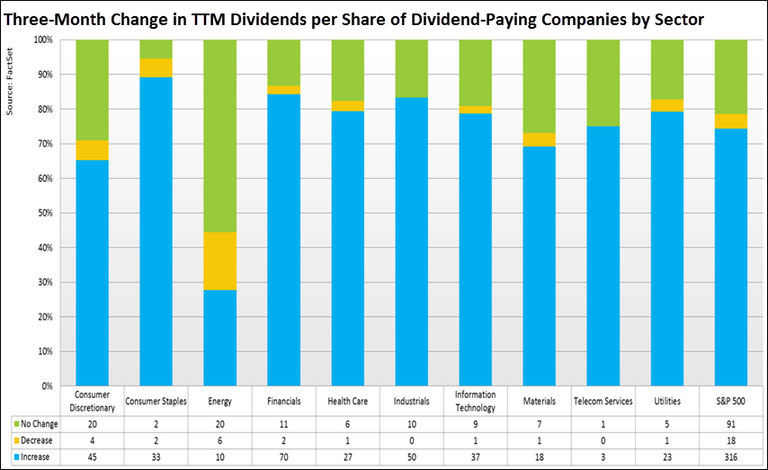
Similar to Q3, the Energy sector led all groups in terms of dividend decreases in Q4. Within the sector, six companies paid out TTM dividends per share that were lower than the amount paid out a quarter ago. Two of the contributors were Marathon Oil Corp and Kinder Morgan. Marathon Oil announced a reduction of its quarterly dividend from $0.21 to $0.05 back in late October.
Lee M. Tillman, the firm’s President and CEO, commented on the dividend cut by saying, “We believe the revised dividend appropriately addresses the uncertainty of a lower for longer commodity price environment. The decision aligns with our priority of maintaining a strong balance sheet through the cycle and provides us additional capital flexibility to support growth from our deep inventory of investment opportunities in the U.S. resource plays when commodity prices improve.”
KinderMorgan, the largest pipeline operator in North America, lowered its quarterly dividend by 75% to $0.125 back in January. Additionally, exploration and production firm, ConocoPhillips, and offshore drilling services firm, Ensco plc, announced dividend cuts recently.
With aggregate dividends in the S&P 500 rising and aggregate earnings in the index slumping, S&P 500 TTM payout ratio reached 37.9% in Q4, the largest ratio since Q3 2009, when it was nearly 50%. The dividend payout ratio in Q4 increased 15.4% on a year-over-year basis. The S&P 500 TTM dividend yield in Q4 was 2.2%. This value represented an 11.8% premium to the index’s 10-year median yield. It also marked a 14.5% increase compared to the dividend yield a year ago.
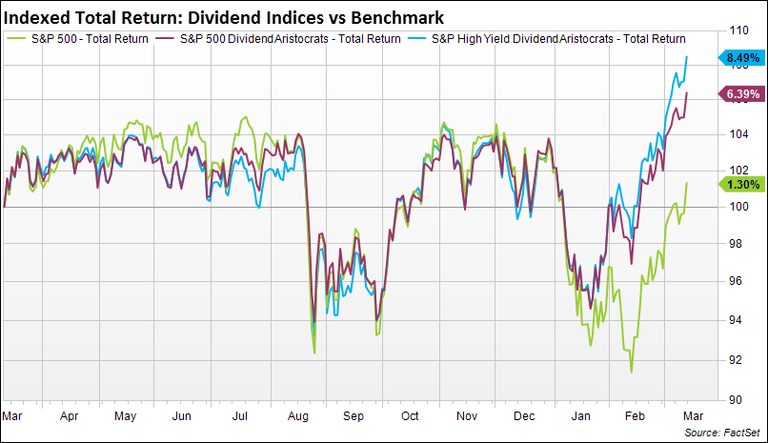
To analyze the performance of dividend paying stocks, we used the S&P High Yield Dividend Aristocrats (SPHYDA) index and the S&P 500 Dividend Aristocrats index (SP50DIV). The SPHYDA measures the performance of companies within the S&P Composite 1500 that have consistently increased their dividends every year for at least 20 years. The SP50DIV measures the performance of companies within the S&P 500 that have increased their dividends every year for the last 25 consecutive years. This index is equal weighted.
In the past year, the dividend indices have outperformed the S&P 500 on a total return basis. The S&P High Yield Dividend Aristocrats index increased 8.5% and the S&P 500 Dividend Aristocrats gained 6.4%, while the S&P 500 increased only 1.3% (as of Friday’s close). The performance of the dividend indices also exceeded that of the S&P 500 when narrowing the time frame to only Q4 (October 31,2015-January 31, 2016). The SPHYDA and SP50DIV fell 3% and 2.5%, respectively in Q4, while the S&P 500 dropped 6.2% on a total return basis.
When separating out the dividend payers and the non-dividend payers in the S&P 500 and analyzing performance, dividend paying stocks saw an average monthly equal weighted return of -0.8% in the past year. This exceeded the non-dividend payers’ return of -1.2% in the past year. This performance analysis can also be done using a market-cap weighted cumulative return and measured relative to the S&P 500 Total Return index. In the past year, dividend paying stocks saw an excess weighted cumulative return of -1.6% relative to the index, while non-dividend paying stocks saw a return of 6.9% relative to the index.
Using this methodology, dividend payers underperformed the S&P 500 Total Return index and non-dividend payers outperformed the index. Several of the major constituents driving this trend are Alphabet, Facebook, and Amazon. These non-dividend payers are three of the largest weighted stocks in the index due to their high market cap and are also some of the top performers over the past year. Additionally, Apple, which does pay a dividend, has the largest market cap of any S&P 500 company and is down 18% in the past year.
Even with shareholder buybacks and dividend distributions for companies in the S&P 500 hovering near record levels, activist investors have continued to push for more. In 2015, there were 70 activist campaigns in which a dissident objective was to return cash via dividends and/or buybacks. This was a 37% increase from the number in 2014 (51 campaigns) and represented the highest total since FactSet began tracking the data in 2005.
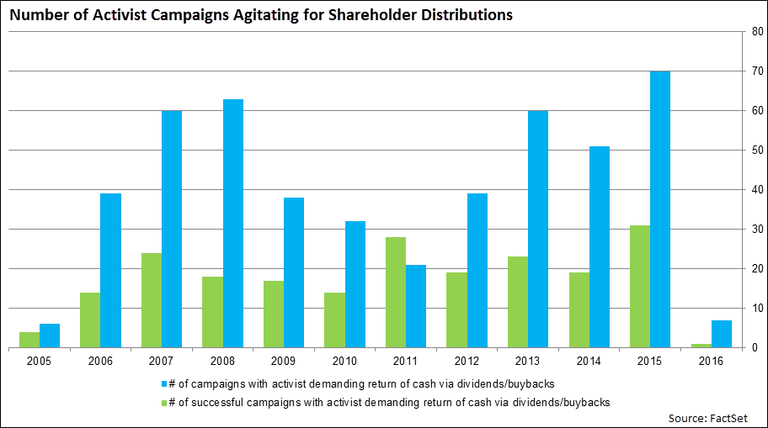
Of these 70 activist campaigns in 2015, the activists were successful in 31 campaigns, which was another record high. Examples of success include: the company declaring a special one-time dividend, increasing its regular dividend, announcing a new share repurchase program, and expanding its existing share repurchase program. So far in 2016, there have been seven total campaigns in which a dissident objective was to return cash via dividends and/or buybacks. One of these campaigns has been successful.

Where Are Analysts Most Optimistic on Ratings for S&P 500 Companies Heading Into Q2?
Stay updated with this earnings insight from FactSet, summarizing analyst ratings on stocks in the S&P 500 with the start of the...
More Than 65% of S&P 500 Earnings Calls for Q4 Cited “AI”
Stay updated on the S&P 500 with this earnings insight from FactSet, featuring analysis of AI mentions at the aggregate and...
Number of S&P 500 Earnings Calls Citing “Tariffs” Declined for 3rd Straight Quarter
Stay updated on the S&P 500 with FactSet. This report summarizes tariff mentions during earnings calls the past three months at...
Earnings Insight Infographic: Q4 2025 By the Numbers
Get a quick look back at S&P 500 aggregate performance with these key highlights of the fourth quarter 2025 earnings season from...
The information contained in this article is not investment advice. FactSet does not endorse or recommend any investments and assumes no liability for any consequence relating directly or indirectly to any action or inaction taken based on the information contained in this article.

