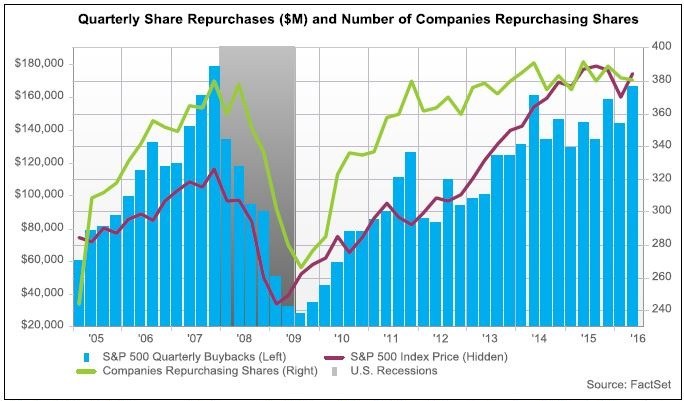
Companies in the S&P 500 spent $166.3 billion on share buybacks during the first quarter of 2016, marking a new post-recession high. Since 2005, only Q3 2007 produced a larger amount of buybacks ($178.5 billion). Dollar-value buybacks in Q1 represented a 15.1% spending increase from the year-ago quarter, and a 15.6% jump from Q4. This breakout in the first quarter of the year comes amid a slight stabilization period for buybacks since the middle of 2014. With that said, buyback spending remained at very high levels for the index during this period.
Related: Hedge Funds Shuffle IT Holdings in Q1
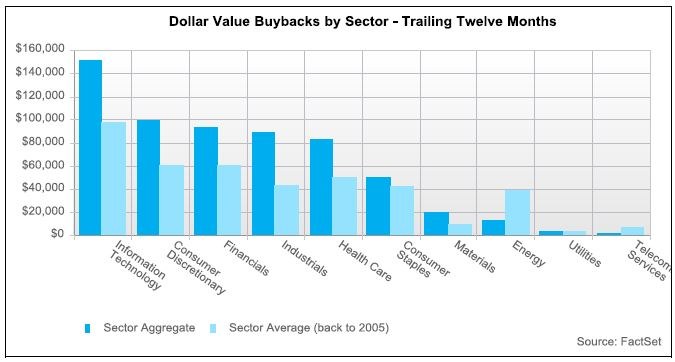
The Information Technology sector was the top spending group in terms of dollar-value buybacks ($34.4 billion). However, a variety of sectors helped aggregate buybacks break post-recession records during Q1. Share buybacks in the Health Care sector amounted to $33.2 billion, which was the largest quarterly amount for the sector since FactSet began tracking the data in 2005. This blew away the previous high for Health Care from Q2 2012, when spending totaled $24.5 billion.
In addition to the Health Care sector, the Consumer Discretionary, Industrials, and Consumer Staples sectors were all major contributors to the index’s record level of buyback spending. The Q1 aggregate buyback total in the Consumer Staples and Industrials sectors also marked post-recession highs, with Q3 2007 being the only quarter to produce larger buyback totals for these sectors since 2005. The Q1 buyback total in the Consumer Discretionary sector was the third largest amount going back to 2005. These three sectors also toppled their long run average of quarterly repurchases.
The Health Care sector was the second largest group in terms of aggregate spending on share repurchases and year-over-year growth in repurchases. The quarterly total of dollar-value buybacks exceeded its long run average (back to 2005) by over 150%. Three of the top 10 companies ranked by dollar-value buybacks were in the Health Care sector (Pfizer, Gilead Sciences, and Express Scripts). This list has typically been dominated by firms in the Information Technology sector.
Related: Share Repurchases Grew 5.2% Year-Over-Year in Q4
Consumer Sectors Spur Year-Over-Year Growth
The Consumer Staples sector led all major sectors (excluding the Telecom and Utilities sectors, which have each averaged less than $2 billion in quarterly buybacks since 2005) in terms of year-over-year growth (+72.4%) for quarterly buybacks. The Consumer Discretionary sector was also a major contributor, posting a growth rate of 36.1%. Five out of the eight buyback groups saw positive year-over-year growth in Q1, with each of those groups achieving double-digit growth rates (Consumer Staples, Health Care, Consumer Discretionary, Industrials, and Financials). The Information Technology sector, which was the top group in terms of quarterly buyback spending, posted a 5.3% decline in year-over-year dollar-value buybacks.
Buyback Yield Climbs to Highest Ratio Since Q1 2014
The trailing 12-month (TTM) buyback yield for the S&P 500 climbed to 3.3% by the end of Q1, which marked the highest ratio for the index since Q1 2014. The index’s buyback yield has been at or below the long run average ratio (back to 2005) for the past four quarters. The TTM buyback yield ending in Q1 represented a 9.2% premium to the long run average, and a 15.6% increase from the ratio a year ago. Buyback yield is defined as the aggregate number of shares repurchased over the trailing 12 months as a percentage of the aggregate common shares outstanding.
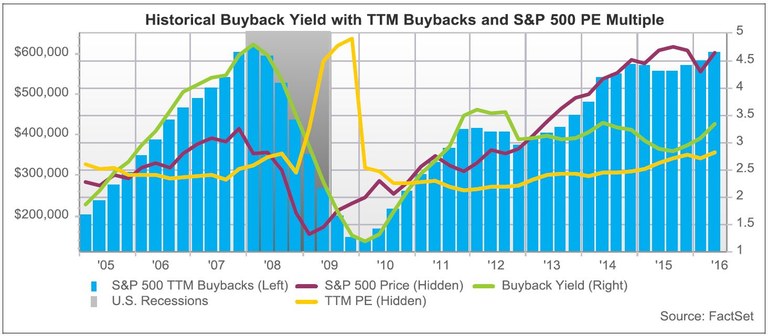
Looking solely at the S&P 500 buyback yield for the quarter (rather than the TTM period), the number of shares repurchased during the quarter made up 0.9% of the aggregate shares outstanding in the index. This was the highest buyback yield for a quarter since Q3 2011, when the ratio reached 1.2%. Part of this rise in buyback yield may be attributed to a lower S&P 500 price level than a year ago. The average price level for the S&P 500 index in Q1 2016 (January 31-April 30) was 4% lower than the average price level for the index in Q1 2015. In a market with lower prices, companies are able to repurchase a larger number of shares, which drives up the buyback yield. This is evident when looking at the count of shares repurchased during the first quarter. In Q1, companies in the S&P 500 bought back 3.1 billion shares, a significant increase from the 2.3 billion shares repurchased in the year-ago quarter.


