

The United Kingdom will be a focus for the market during the upcoming week, as the country is scheduled to hold a vote on June 23 regarding its membership in the European Union. There are concerns in the market about the potential negative impact on the economy of the United Kingdom should the country decide to leave the European Union. Given these concerns, how much revenue exposure does the S&P 500 have to the United Kingdom? Which sectors and companies in the index have the highest revenue exposure to the UK?
Related: UK’s EU Referendum Looms Large for Markets
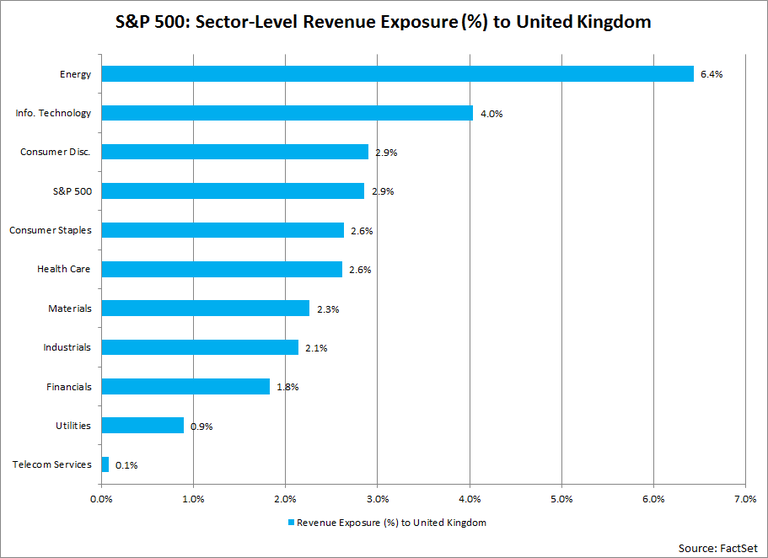
According to FactSet Market Aggregates and FactSet Geographic Revenue Exposure data (based on the most recently reported fiscal year data for each company in the index), the aggregate revenue exposure of the S&P 500 to the United Kingdom is 2.9%. This is the third highest country-level revenue exposure for the index, trailing only the United States (68.9%) and China (4.8%).
At the sector level, the Energy (6.4%) and Information Technology (4.0%) sectors have the highest revenue exposures to the United Kingdom.
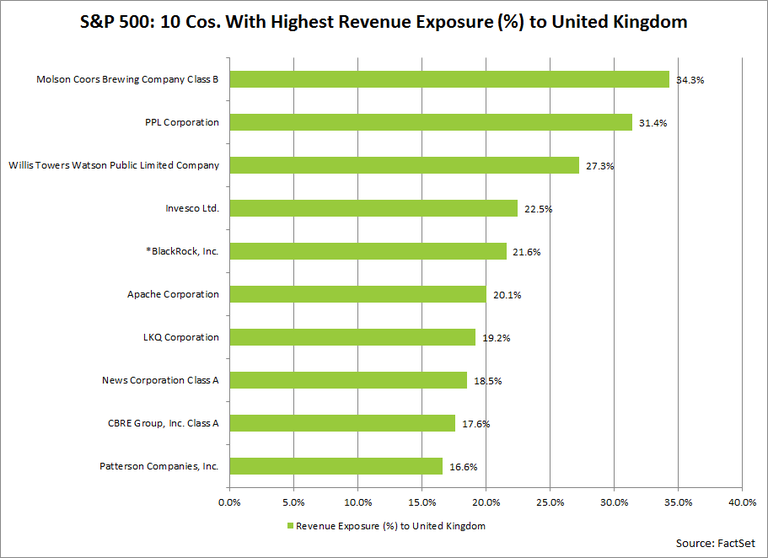
At the company level, 29 companies in the S&P 500 have revenue exposure of more than 10% to the United Kingdom, led by Molson Coors Brewing (34%) and PPL Corporation (31%).
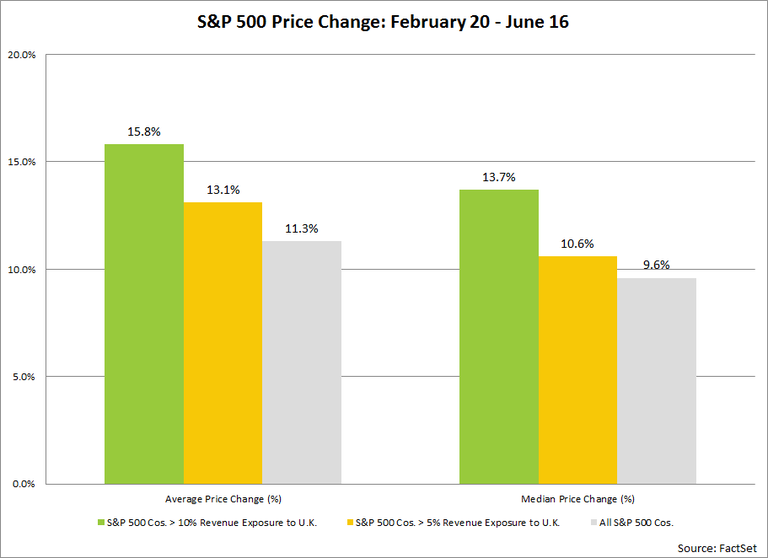
It is interesting note that since February 20 (the date the UK announced the June 23 timeline for the EU vote), the companies in the S&P 500 with more revenue exposure to the UK have seen higher average and median price increases relative to the index as a whole.
Related: In Search of the Brexit Hedge
For the entire S&P 500 index, the average price change for a stock from February 20 through June 16 was +11.3%. For the companies in the index with more than 10% revenue exposure to the United Kingdom, the average price change for a stock over this period was +15.8%. For the entire S&P 500 index, the median price change for a stock from February 20 through June 16 was +9.6%. For the companies in the index with more than 10% revenue exposure to the United Kingdom, the median price change for a stock over this period was +13.7%.

Mr. John Butters is Vice President and Senior Earnings Analyst at FactSet. His weekly research report, “Earnings Insight,” provides analysis and commentary on trends in corporate earnings data for the S&P 500 including revisions to estimates, year-over-year growth, performance relative to expectations, and valuations. He is a widely used source for the media and has appeared on CNBC, Fox Business News, and the Business News Network. In addition, he has been cited by numerous print and online publications such as The Wall Street Journal, The Financial Times, The New York Times, MarketWatch, and Yahoo! Finance. Mr. Butters has over 15 years of experience in the financial services industry. Prior to FactSet in January 2011, he worked for more than 10 years at Thomson Reuters (Thomson Financial), most recently as Director of U.S. Earnings Research (2007-2010).

Industry Analysts Project 21% Increase in S&P 500 Price Over the Next 12 Months
FactSet S&P 500 earnings report: Explore sector price predictions and top/bottom 10 stocks with largest differences between...
Where Are Analysts Most Optimistic on Ratings for S&P 500 Companies Heading into Q3?
FactSet earnings report: Ahead of Q3, explore the percentage of analysts' buy, hold, and sell ratings among the 12,840 ratings on...
Number of S&P 500 Earnings Calls Citing “Inflation” Increased for 3rd Straight Quarter
FactSet S&P 500 earnings report: the term “inflation” was cited on 220 earnings calls from March 15 through June 11. Explore...
Highest Number of S&P 500 Earnings Calls Citing “AI” Over the Past 10 Years
FactSet S&P 500 earnings report: The term “AI” was cited on 337 earnings calls conducted from March 15 - June 11, well above the...
The information contained in this article is not investment advice. FactSet does not endorse or recommend any investments and assumes no liability for any consequence relating directly or indirectly to any action or inaction taken based on the information contained in this article.
