
By Joe Importico, CFA, FRM | July 20, 2015
No matter how you define your ideal subset of securities, there are often a number of quantitative metrics available to help identify the type of company you're looking for. Say you're a manager following a value strategy. How might you go about identifying your top candidates within a given market? For starters, you could comb through a variety of quantitative measures, such as relative valuation multiples, levels of sustained profitability, rates of return on capital vs. costs of capital, and so on. Then, once you've identified the desired characteristics, you may apply thresholds to ensure the only companies that pass, and thus warrant additional analysis, are those meeting your predefined preferences. This method is common within the investment community as a way of introducing efficiencies to the sometimes arduous task of security selection.
Identifying quantitative measures to screen on and applying constraints is seemingly straightforward, but there are, as always, limitations to the flexibility offered by such an approach. One notable limitation comes in the form of being able to integrate qualitative information into the screening process. Where quantitative measures can assist in identifying the profile of a company, or in this case, set of companies, qualitative measures will help us better understand the market's perception surrounding these companies.
So how can individuals harnessing a security selection process go about integrating qualitative metrics like investor sentiment into their process? Some investors back into this approach by using quantitative measures that capture negative sentiment, such as increased short sale volume relative to a predefined trading interval or insider trading patterns, as ways to denote market sentiment. Both short sale volume and insider trading are implicit ways to capture sentiment, but we're still missing the ever-changing landscape of news and media. One readily available way to integrate qualitative, sentiment driven analytics into a security selection process is through a pre-defined database like RavenPack, which offers a variety of indicators that quantify positive and negative perceptions based on opinions and facts reported through the media. The specific metrics available span sentiment, volume, and abnormality indicators.
To test the usefulness of these indicators, I focused on the sentiment strength indicator over the trailing 91 day period, applying the RavenPack indicators via FactSet's alpha testing tool. The sentiment strength indicator can be applied in isolation or as a complement to augment another factor. I'll detail both approaches at a high-level, starting with evaluating the efficacy of this factor in isolation within the Russell 2000 index.
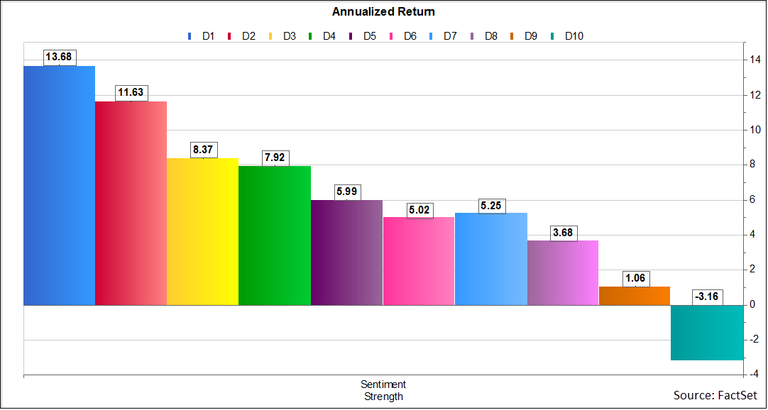
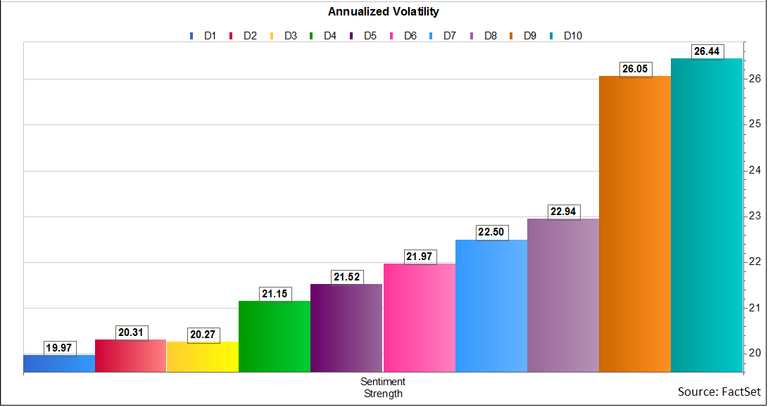
To start, let's get a closer look at the profile of this factor from a risk and return perspective. In the charts below, I've partitioned the companies in the Russell 2000 into deciles based on their 91-day sentiment strength scores. From there I've annualized the returns and volatilities attributable to each group. As you can see, there is a clean monotonic descent from a return perspective and a desirable ascent when viewing fractile volatilities.
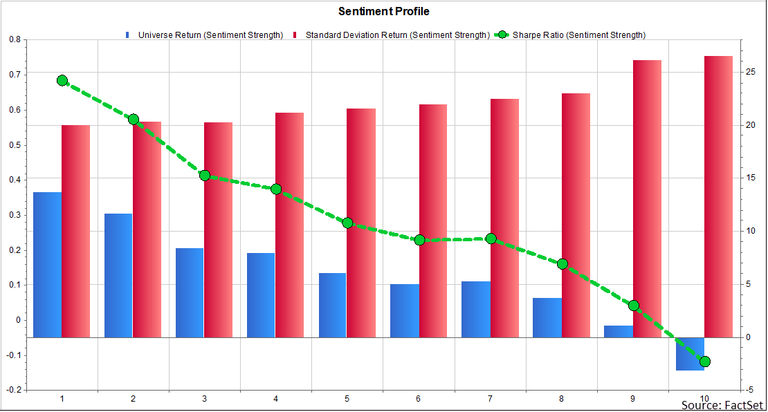
By combining the two datasets shown above into the same illustration, I'm able to overlay the risk adjusted returns through the Sharpe Ratio. Again, as we'd expect based off of the earlier graphs, we have a desirable trade-off of risk to return as we move from the top decile to the bottom decile, where the top decile earns approximately 70 basis points per unit of risk.
Taking a closer look at the time-series progression of those return figures, I plotted the cumulative returns by decile on both an absolute and active basis, where the active return is taken relative to the Russell 2000 index. For this example, all portfolios returns are equal weighted.
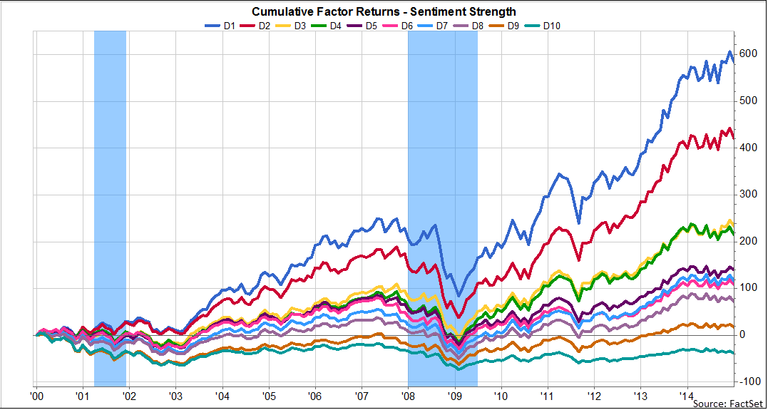
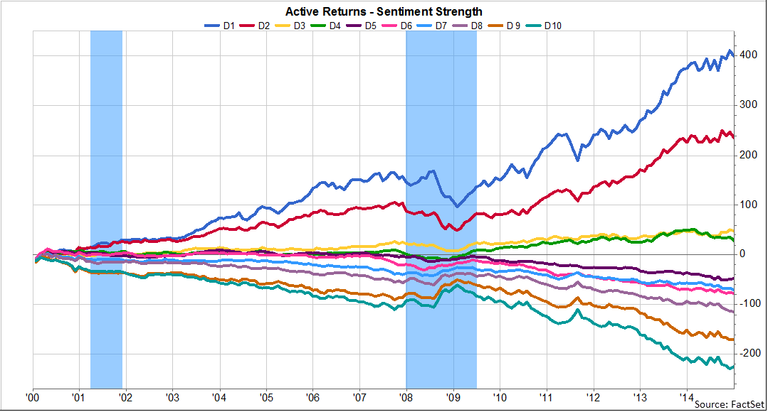
The top decile of our Sentiment Strength factor yields a cumulative return of approximately 600% from December 2000-December 2014 and nearly 400% over the cumulative return of the Russell 2000 index. By focusing on the Active Returns results, we not only see the marked outperformance that can be gained by tilting a strategy toward the top ranked securities as measured by Sentiment Strength, but also a way to filter out underperformers based on the market's perception. Deciles five through 10 all underperform the Russell 2000 to varying extents; being able to monitor your portfolio for signs of poor market perception could inhibit both absolute and active returns in a material way.
Reverting to the top decile of Sentiment Strength, I examined performance statistics over the trailing one-, three-, and five-year periods and the entire timeframe of the study, as shown in the table below. The top decile registers a positive annualized active return over each of the periods shown below, all with a lower level of volatility.
The "% > Benchmark" columns proved particularly interesting, in that the top decile runs at a beta slightly under 1, with a lower volatility profile, yet for the entire period, the top decile outperforms in both up and down markets at a clip of greater than 60%.

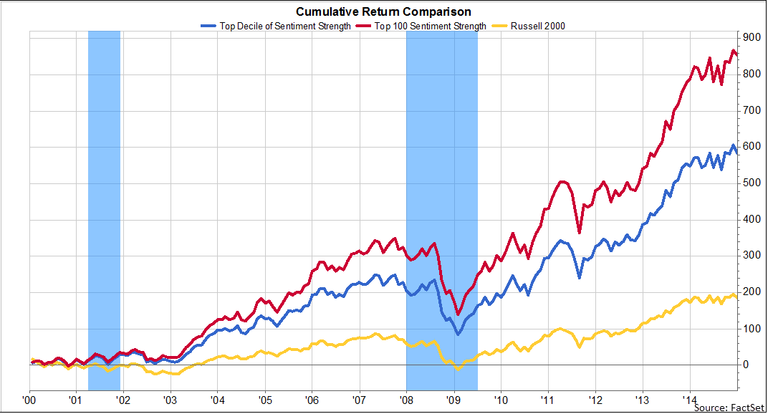
The Sentiment Strength indicator becomes especially important as we go further into the tails. For the Russell 2000 index, for example, decile portfolios should show more promise than portfolios formed with quintiles. In other words, securities embodying extremely high sentiment should outperform other securities with merely high levels of sentiment. To test this, I compared the cumulative return of the Russell 2000, the top decile of Sentiment Strength (around 200 securities) and a newly formed portfolio containing the top 100 securities ranked by their sentiment score. As expected, the portfolio formed around the top 100 has a considerable value-add when measured relative to the Russell 2000 and the top decile.
To test the RavenPack indicators alongside other security attributes, I used two readily familiar attributes: 12-month momentum and earnings yield, where 12-month momentum is defined as the trailing one-year return on a stock excluding the most recent month and earnings yield is defined as trailing 12-month earnings per share over price.
To combine the factors, I took two rather simple approaches. For momentum, I began by partitioning the Russell 2000 into deciles, where the securities with the greatest price appreciation over the trailing 12 months are placed into the top decile (D1) and the securities greatest price depreciation are placed into the bottom decile (D10). Then, I analyzed the decile performance within different market environments. The graph below details the annualized decile returns for 12-month momentum in high, medium, and low volatility environments.
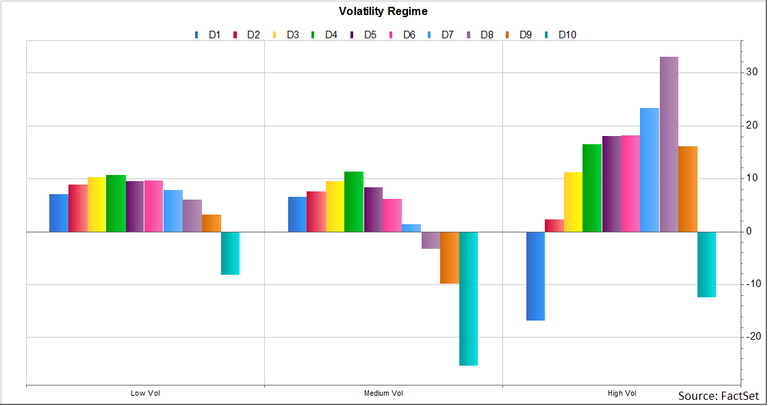
The overall relationship of the D1 outperforming D10 is present in both the low and medium volatility environments, whereas momentum produces a very erratic return distribution during periods when there is a lot of market duress. For simplicity, I chose environments that are conducive to momentum -- those that are low and medium volatility -- and used momentum to evaluate securities during those periods. Then, for the high volatility periods, I evaluated securities based on their market sentiment.
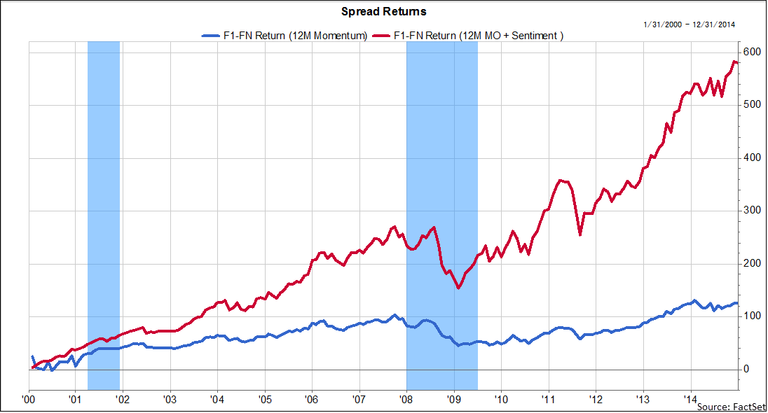
As shown below, the newly formed factor comprised of 12-month momentum and Sentiment Strength is titled "12M MO + Sentiment." The spread returns show the performance we're able to achieve by focusing on market sentiment during high volatility periods and momentum during more tranquil periods.
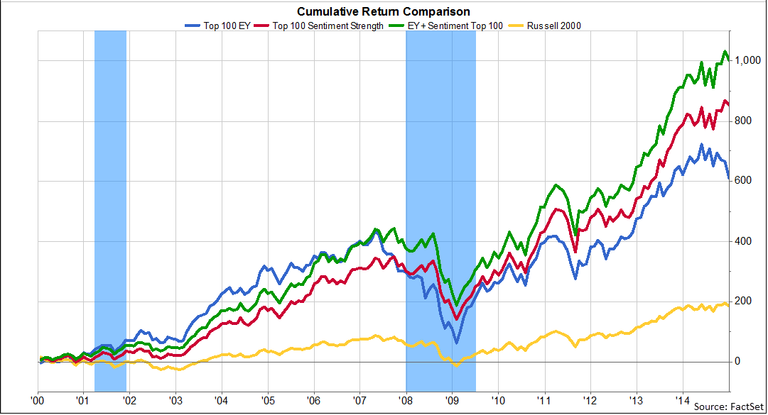
In my second example, I tested the performance of securities exhibiting high levels of positive sentiment that are also trading at cheap multiples of price to earnings. To do so, I combined earnings yield and Sentiment Strength by ranking the earnings yield and sentiment factors, applied an equal weight to the ranks of both attributes, and then summed the ranks. Once the ranks were summed, I held the top 100 on a monthly basis. The output of that combination is titled "EY + Sentiment Top 100" and is shown in the performance chart below. Holding securities with positive sentiment, trading at cheap multiples, outperforms Sentiment Strength and earnings yield, respectively.
Qualitative information is all around us, but very difficult to capture, synthesize, and integrate into a security selection process. Company-specific news is being generated rapidly, and while the quality of the content can be contended, the sheer volume and impact on security prices cannot. In our tests, the usefulness of pre-defined sentiment indicator databases like RavenPack is tested in isolation and as a supplement to other factors. In both cases, the sentiment indicators show promise with respect to how sentiment is affecting security price movements.

How Private Capital Is Powering the Johor-Singapore Special Economic Zone
This FactSet analysis provides insight into the early stage of the JS-SEZ progress with key data points. Stay informed on how...

How Transaction Cost Analysis Is Evolving from Compliance Tool to Trading Decision Support
Discover insights to further strengthen your TCA capabilities in this FactSet analysis. Consider how you can make the most of TCA...
The information contained in this article is not investment advice. FactSet does not endorse or recommend any investments and assumes no liability for any consequence relating directly or indirectly to any action or inaction taken based on the information contained in this article.