With a new fall semester just around the corner, retail will be a focus area for the market over the next few weeks. Spending on “back to school” items (clothes, school supplies, etc.) will likely increase during this time frame. Over the past year, internet retailers like Amazon.com have reported some of the highest earnings growth rates among all retailers. Is this trend projected to continue during the back to school shopping season? Which brick and mortar retailers are expected to outperform and underperform their peers during this period?
One note: we are using the calendar third quarter for our analysis because this quarter includes the back to school shopping months of August, September, and October for most retailers.
EPS Growth: Amazon.com Expected to Earn an “A"
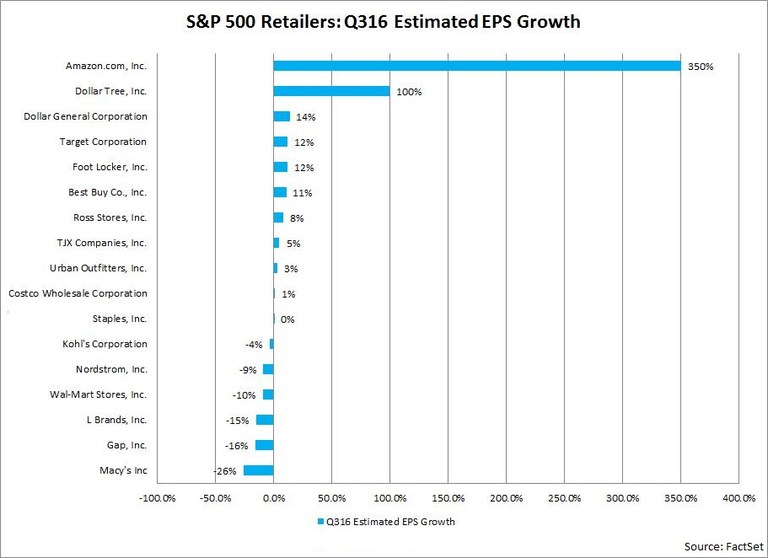
Growth in earnings per share (EPS) is one way to measure the financial strength of a corporation. To analyze EPS growth, we compared the mean EPS estimate (based on estimates submitted to FactSet by industry analysts) to the actual EPS number reported in the year-ago quarter for each company and ranked the year-over-year percentage change. Retailers in the following S&P 500 retail sub-industries were included in the EPS growth analysis because they will likely see some impact from back to school shopping: Apparel Retail, Computer & Electronics Retail, Department Stores, General Merchandise Stores, and Hypermarkets & Super Centers.
In addition to the 15 retailers in these five sub-industries, we included Amazon.com from the Internet Retail sub-industry and Staples from the Specialty Store sub-industry in the company-level analysis for EPS growth.

Of these 17 S&P 500 retailers, Amazon.com is by far expected to report the highest EPS growth, at 350%. The mean EPS estimate for Q3 2016 is $0.77, compared to year-ago EPS of $0.17. If Amazon.com reports year-over-year growth in EPS for Q3 2016, it will mark the sixth straight quarter the company has done so. However, it is interesting to note that analysts have lowered estimates for Amazon.com by 21% (to $0.77 from $0.98) since the start of the third quarter (June 30). This marks the largest decline in the mean EPS estimate for these 17 retailers over this time frame. Despite these cuts to EPS estimates, the company is still expected to be the top performer in terms of EPS growth.
Dollar Tree is expected to report the second highest EPS growth within this group of retailers at 100%. The mean EPS estimate for Q3 2016 is $0.76, compared to year-ago EPS of $0.38. If Dollar Tree reports year-over-year growth in EPS for Q3 2016, it will mark the third consecutive quarter the company has done so, a departure from the three straight quarters of year-over-year EPS declines the company posted from calendar Q2 2015 through calendar Q4 2015. Analysts have made no substantial changes to their EPS estimates for Dollar Tree in recent weeks, as the mean EPS estimate of $0.76 today is unchanged from June 30 ($0.76).
EPS Underperformer: Macy’s
On the other hand, Macy’s is projected to report the largest decline in EPS of these 17 retailers at -26%. The mean EPS estimate for Q3 2016 is $0.41, compared to year-ago EPS of $0.56. If Macy’s reports a year-over-year decline in EPS for Q3 2016, it will mark the seventh straight quarter in which the company has reported a year-over-year decrease in EPS.
It is interesting to note that analysts have raised estimates for Macy’s by 14% (to $0.41 from $0.36) since the start of the third quarter (June 30). This marks the largest increase in the mean EPS estimate for these 17 retailers over this time frame. However, despite these increases to EPS estimates, the company is still expected to be the weakest performer in terms of EPS growth.

Growth in Number of Stores Open: Dollar General is in the Money
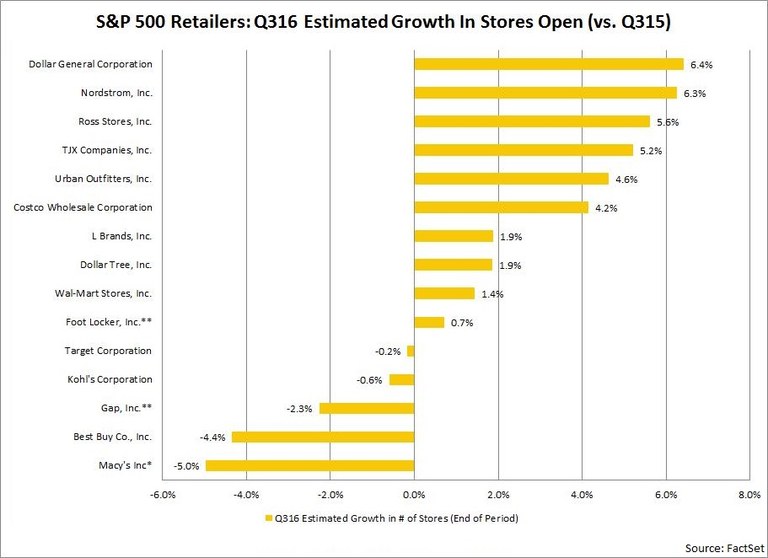
Growth (year-over-year) in the number of stores open at the end of the quarter is another way to measure the financial health of a corporation, particularly for retailers. To perform this analysis, we compared the mean estimate for number of stores open (submitted to FactSet by industry analysts) at the end of the calendar third quarter of 2016 to the number of stores open a year-ago and ranked the percentage change. Retailers in the following S&P 500 retail sub-industries were included in the analysis: Apparel Retail, Computer & Electronics Retail, Department Stores, General Merchandise Stores, and Hypermarkets & Super Centers.
Outperformers: Dollar General & Nordstrom
Of these 15 S&P 500 retailers, Dollar General is expected to report the highest year-over-year growth in the number of stores open for the third quarter at 6.4%. The mean estimate for stores open at the end of Q3 2016 is 13,192, compared to 12,396 stores open at the end of Q3 2015.
Nordstrom is expected to report the second highest year-over-year growth in the number of stores open for the third quarter at 6.3%. The mean estimate for stores open at the end of Q3 2016 is 343, compared to 323 stores open at the end of Q3 2015.
Underperformers: Macy’s and Best Buy
On the other hand, Macy’s is predicted to report the largest year-over-year decline in the number of stores open (Macy’s stores only) at -5.0%. The mean estimate for stores open at the end of Q3 2016 is 783, compared to 824 stores open at the end of Q3 2015. More trouble may lie ahead, as Macy's announced last week that it plans to shut another 100 stores, most by early 2017.
Best Buy is projected to report the second largest year-over-year decline in the number of stores open at -4.4%. The mean estimate for stores open at the end of Q3 2016 is 1,574, compared to 1,646 stores open at the end of Q3 2015.

Projected Overall Outperformers and Underperformers for Back to School Retail in S&P 500
Based on these three metrics, which S&P 500 retailers involved in back to school sales are expected to be the overall outperformers and underperformers for the third quarter? To perform this analysis, we ranked all the retailers in each category and took an average of the three rankings to calculate an overall ranking.
Overall Outperformers: Amazon.com and Dollar General
Amazon.com finished at the top of the list of this group of retailers. However, it should be noted Amazon.com was only ranked in the EPS category. Because the company is an online retailer, it does not report same store sales or report number of stores open.
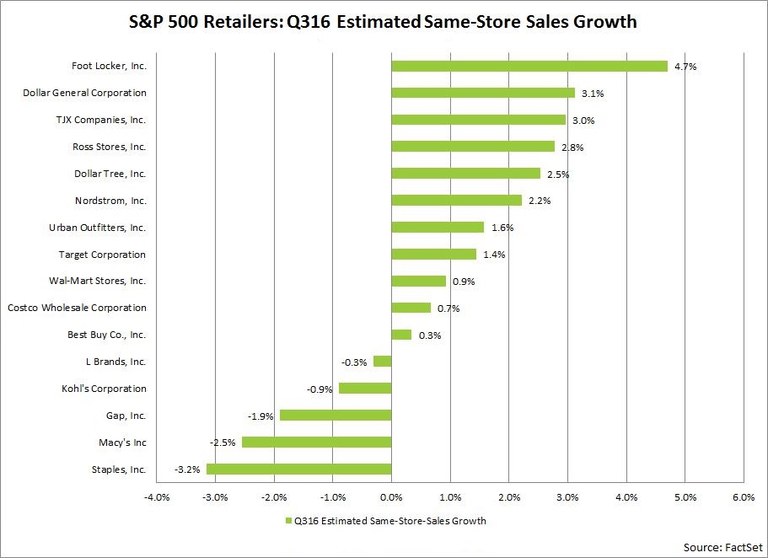
Dollar General had the second highest average rank overall on this list of retailers. The company is projected to report the third highest growth in EPS, second highest growth in same-store-sales, and the highest percentage increase in stores open at the end of the quarter within this group of retailers.
Overall Underperformers: Macy’s and Gap Stores
On the other hand, Macy’s had the lowest average rank overall on this list of retailers. The company is projected to report the largest decline in EPS, second largest decline in same-store-sales, and largest percentage decline in stores open at the end of the quarter within this group of retailers.
| Select S&P 500 Retailers: Average Rank By Growth in EPS, SSS, and # of Stores for Q3 2016 |
| Company |
EPS Growth Rank |
SSS Growth Rank |
# Stores Growth Rank |
Average Rank |
| Amazon.com, Inc. |
1 |
N/A |
N/A |
1.0 |
| Dollar General Corporation. |
3 |
2 |
1 |
2.0 |
| Ross Stores, Inc. |
7 |
4 |
3 |
4.7 |
| TJX Companies, Inc. |
8 |
3 |
4 |
5.0 |
| Dollar Tree, Inc. |
2 |
5 |
8 |
5.0 |
| Foot Locker, Inc. |
5 |
1 |
10 |
5.3 |
| Nordstrom, Inc. |
13 |
6 |
2 |
7.0 |
| Urban Outfitters, Inc. |
9 |
7 |
5 |
7.0 |
| Target Corporation |
4 |
8 |
11 |
7.7 |
| Costco Wholesale Corporation |
10 |
10 |
6 |
8.7 |
| Best Buy Co., Inc. |
6 |
11 |
14 |
10.3 |
| Wal-Mart Stores, Inc. |
14 |
9 |
9 |
10.7 |
| L Brands, Inc. |
15 |
12 |
7 |
11.3 |
| Kohl's Corporation |
12 |
13 |
12 |
12.3 |
| Staples, Inc. |
11 |
16 |
N/A |
13.5 |
| Gap, Inc. |
16 |
14 |
13 |
14.3 |
| Macy's Inc. |
17 |
15 |
15 |
15.7 |
Gap had the second lowest average rank overall on this list of retailers. The company is expected to report the second largest decline in EPS, the third largest decline in same-store-sales, and the third largest percentage decline in stores open at the end of the quarter within this group of retailers.
