In a world of increasing global trade and complex supply chains, it can be difficult to assess the impact of market-moving events on your portfolio. For example, it’s clear that fears of an economic slowdown in China would have a negative impact on Chinese stocks or even foreign stocks with observable ties to the Chinese economy, like Australia’s Fortescue Metals Group, Taiwan’s Delta Electronics, or Japan’s Murata Manufacturing. But it’s less clear what kind of impact this would have on, say, U.S.-based Yum! Brands (which, surprisingly, derives 53% of its revenues from China), South Korean company LG Chem (32%), or France’s Hermès (19%).
In such an interconnected world, it’s in the best interest of investors to analyze market shocks from 2016 to find ways to prepare for potential shocks in 2017.
Looking Back
2016 started off on a sour note when China, the world’s second largest economy, announced that its GDP had grown only 6.9% in 2015, the slowest annual rate in 25 years. Global equity markets pulled back in response, but outside of China the impact was felt most by stocks with higher revenue exposure to China. Markets began to react before the official announcement as analysts and economists adjusted their expectation downward. The early downward move in the performance of high exposure stocks acted as a signal for what was to come. Below we can see the USD return of the MSCI AC World ex China from December 1, 2015 to February 11, 2016, split out by stocks with high (>=20%) or low (<20%) exposure to China. The grey region depicts date of announcement.

The surprise result of the UK’s referendum on membership to the European Union, or Brexit, has brought with it many questions, some of which will stay unanswered for some time. Though the impact on Britain’s equity markets has been limited so far—the FTSE 100 is actually up in sterling terms and no worse than flat in euro terms since the vote—there has been a negative impact on European stocks with high revenue exposure to the UK. The chart below represents EUR return of the MSCI Europe ex UK from March 23, 2016 to September 23, 2016, split out by stocks with high (>=20%) or low (<20%) exposure to the UK. The grey region depicts date of vote.

As with Brexit, the election of Donald Trump to the United States’ presidency raises many questions, from tax policy—and its impact on economic health and consumer spending—to America’s stance on trade. In another similarity with Brexit, pollsters were not expecting the result, though you can see the performance of high- and low-exposure stocks diverge in mid-October, three weeks before election day. Perhaps this is a manifestation of the increasing reality that Trump had a chance. The chart below represents USD return of the MSCI World ex U.S. from October 8, 2016 to December 8, 2016, split out by stocks with high (>=20%) or low (<20%) exposure to the United States. The grey region depicts date of vote.

Applying 2016’s Lessons
Gleaning market expectations before the event through geographic revenue provides additional information about how to position your portfolio. So how can you use this approach to prepare for potential shocks in 2017? Keeping an eye on geographic exposures as events approach and appropriately accounting for how different outcomes would impact the performance of stocks in your portfolio is a good start.
For example, France’s presidential election this spring could put Marine Le Pen, head of the National Front party, at the helm of the EU’s third-largest economy. Le Pen supports protectionist trade policy, has called for a “Frexit” referendum, and has proposed a reworking of the tax code, especially for corporations.
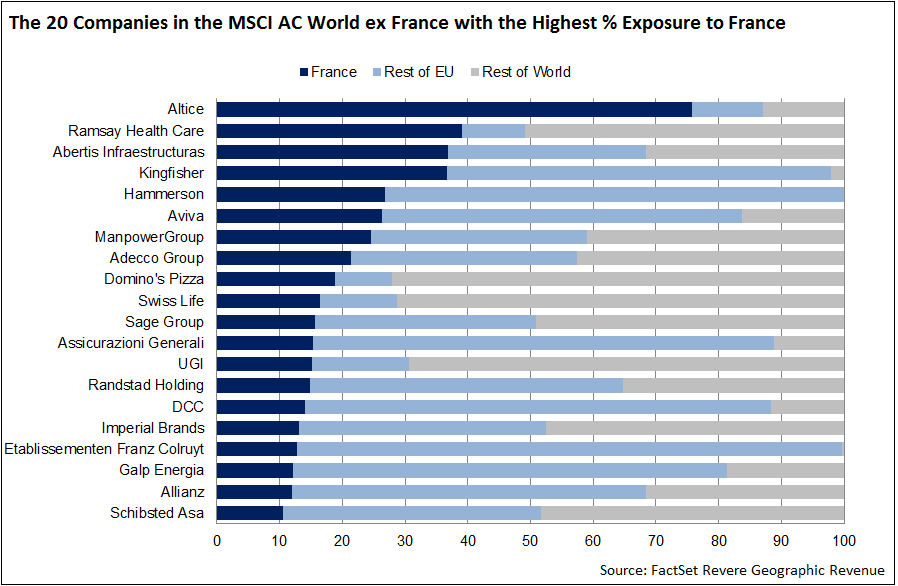
As we’ve seen, the impact of Le Pen’s potential ascension to the presidency would not be felt only by French companies. In fact, there are quite a few non-French companies with significant exposure to France's economy, some of which are not even domiciled in Europe.

Of course, not every event is known ahead of time and geography, or market-based revenue exposure is not always the best method by which to analyze market shocks. While no one knows what will happen in 2017 and what the market impacts will be, including geographic revenue exposure analysis in your investment process can certainly help you be more prepared to position your portfolio appropriately. And in today’s complex world, geographic revenue exposure opens up an additional avenue through which to pursue Alpha or limit downside risk.
