

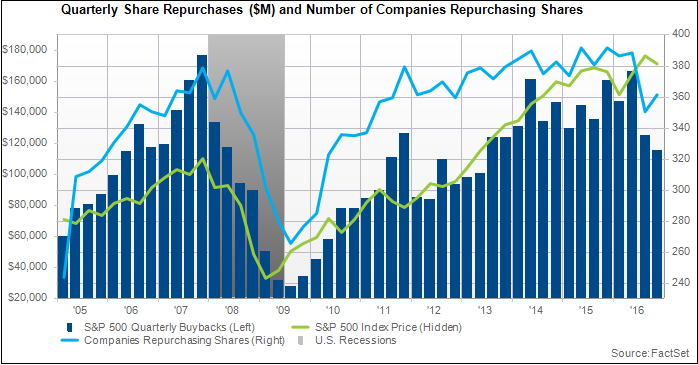
Companies in the S&P 500 spent $115.6 billion on share buybacks during the third quarter, which marked the smallest quarterly total since Q1 2013. Aggregate buybacks in Q3 represented a 28% decline from the year-ago quarter, which was the largest year-over-year decrease since Q3 2009. Keep in mind that Q3 2015 was the fifth largest quarterly total since FactSet began collecting this data in 2005. The third quarter marked the first time the index saw two consecutive quarters of year-over-year declines in buybacks since Q4 2014 and Q1 2015.
On a quarter-over-quarter basis, buybacks fell nearly 8%, which marked the second consecutive quarter of sequential decreases in buybacks. The third quarter, on average, has produced the largest quarterly buyback totals for the S&P 500 index. That was not the case this year. Buybacks during the quarter now stand just 2.7% above the Q3 average going back to 2005. On a trailing 12-month basis, shareholder buybacks amounted to $556.6 billion at the end of the third quarter. This was a 2.6% drop from the same time period a year ago.
The number of S&P 500 companies participating in buybacks in Q3 was 362. This marked an uptick from the 350 companies that repurchased shares during Q2, but was well-behind the count in Q3 2015 (392 companies). This quarter represented the second lowest participation rate in the past 12 quarters (after Q2 2016). The average number of companies in the index repurchasing shares during this time period was 380.
Buyback yield is calculated as the dollar-value buybacks in the trailing 12 months divided by the aggregate market value. The TTM buyback yield at the end of Q3 for the S&P 500 decreased 3.4% year-over-year to 2.86%. Looking at the ratio compared to Q2, there was a 4.7% decline due to the drop in quarterly buybacks. The buyback yield now stands 4.7% below the three-year average buyback yield.
At the sector level, the Industrials and Consumer Discretionary sectors had the largest TTM buyback yields at the end of Q3 (4.5% and 3.8%, respectively). At the company level, American Airlines, Corning, and Navient posted the largest buyback yields (24.9%, 22.2%, and 20.1%, respectively).
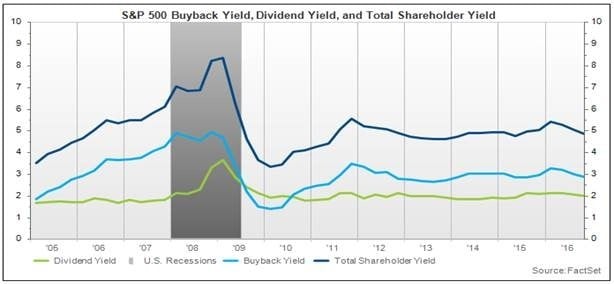
The total shareholder yield (TSY) for the S&P 500 (calculated as TTM gross buybacks plus TTM dividends divided by market capitalization) at the end of the third quarter was 4.83%, which represented a 4.5% decline from the same time period a year ago. The TSY for the period ending in Q3 marked the lowest yield since Q1 2015, when the TSY was 4.78%.
Read more about this quarter's buyback trends in our full report.


Highest Number of S&P 500 Earnings Calls Citing “Oil” Since 2020
Stay current on the S&P 500 with our FactSet earnings report. Explore the trends in oil mentions from Q1 earnings calls overall...
Earnings Insight Infographic: Q1 2026 By the Numbers
Each week, Earnings Insight offers analysis of critical trends in the S&P 500. Here are key highlights of the first quarter 2026...
Analysts Making Largest Increases in Quarterly EPS Estimates for S&P 500 Companies Since 2021
Use the FactSet earnings report to stay informed on earnings trends among S&P 500 companies. Explore our latest quantitative...
“Mag 7” and Other 493 S&P 500 Companies Are Reporting Highest Earnings Growth Since 2021
Stay updated on the S&P 500 with this FactSet earnings report. Explore Mag 7 earnings growth and analysis of GAAP vs non-GAAP...
The information contained in this article is not investment advice. FactSet does not endorse or recommend any investments and assumes no liability for any consequence relating directly or indirectly to any action or inaction taken based on the information contained in this article.

