

Georgi Mitov Ph.D., Emil Margaritov Ph.D, Shamin Parikh also contributed to this article.
This article presents an overview of possible approaches to building scenarios and stress tests based on FactSet data, Portfolio Analytics suite, and risk models. We present scenarios on the possible trajectory of an array of markets and asset classes in the context of the COVID-19 pandemic and the policy responses to it with a special focus on the U.S. equity market. While there are numerous studies with regards to the shape of the expected recovery (e.g., “L,” “U,” “V,”) our focus is twofold: to provide a structural, easy-to-parametrize approach to evaluating the possible recovery paths as well as the ability to quantitatively assess the likelihood of such scenarios. We approach the former via a modification of the Fed-Model, and the latter by offering a Monte Carlo-based reverse stress test framework.
Below, we describe a possible framework for building recovery scenarios and illustrate it based on U.S. equity market data. We examine possible scenarios for the various equity sectors and the forces that may come into play to materialize these outcomes. Then we review a framework for looking into a model-based estimation of the probability for global recovery based on evaluating scenarios’ likelihood using FactSet risk models. The scenarios use the FactSet Economic Estimates database. We finish by demonstrating a possible implementation into FactSet’s Portfolio Analytics tool.
All information, analysis, and scenarios in this article are based on data available as of May 12, 2020. They represent hypothetical scenarios and don’t aim to provide forecasts.
Recovery Scenarios Framework Based on an Equity Valuation Approach
The proposed framework for generating scenarios for the likely future trajectory of equity markets (and equity sectors) is built on the premises of two conceptual assumptions. First, active investors are on an ongoing search for better investment opportunities. Second, active investors considering gaining exposure to the equity market have a whole additional array of investment opportunities to choose from and benchmark equities against. They have easy access to the government bond market that offers both deep liquidity and returns on investment that are considered by many as “risk-free.” Therefore, active asset allocation decisions by investors, who constantly seek opportunities in a multi-asset context, can be expected to bring equilibrium pricing to equity markets. Often referred to as the “Fed Model,” ours is a modification of this framework that has become popular among practitioners in terms of equity market valuation. The framework is transparent and relies on a limited number of parameters, which makes it a good tool to research hypothetical options by just moving a few key assumptions around risk aversion of the market participants and prevailing interest rates. In particular, the 10Y Treasury Yield is being used to proxy in a numerical way the recessionary cycle and monetary and fiscal response blended into one and as well as direct specific representation of the Yield on that security per-se.
We formulate our scenarios for equity market performance at a given future horizon (i.e., end of 2020) by following a set of clear steps:
Applying equation EYt = rt + ERPt using the input estimated as described above gives us the 12-month-ahead earnings yield required at the time horizon of the government bond yield forecast (i.e., end 2020). This also implies an expected 12-month ahead PE ratio at the time horizon of the government bond yield forecast.
We finally recover the expected implied equity price at the relevant forecast horizon Pt by multiplying the implied PE ratio from step three by our current scenario for the 12-month-ahead EPS that is expected to prevail at the time horizon of the government bond yield forecast.
In Table 1, we provide an overview of the calibrations for the model inputs (government bond yield, equity risk premium, and forward EPS) and the resulting implied forward PE ratio at the relevant forecast horizon. It is important to note that the scenarios are highly dependent on the ERP values calculated in relationship with the preselected 10Y-yield band. Choosing a different criterion for ERP calculation would lead to different results. Based on the 1.18% Yield used, the scenario we are generating could be considered one where little government intervention is being offered and/or it is done in a way that doesn’t reach the real business successfully. Alternatively, such a scenario could happen if the markets are pricing in a recovery and a pickup in growth lead to higher term premia and higher yields.
Table 1: Equity Scenario Framework Calibrations
Insight/2020/07.2020/07.15.2020_StressTesting-QuantitativeAssessment/figure1.png)
In this section, we focus specifically on recent developments in the various U.S. equity sectors and apply our framework to provide a more in-depth analysis into potential outcomes for sector performance. Before we turn our attention to specific sector details, we provide a summary of our main observations and scenario findings in Table 2. The table provides several relevant statistics for our analysis: 1) for historical reference we provide market and sector high and low levels from the previous year (High (2019) and Low (2019)); 2) we record the market and sector levels at the start of the year (Start (2020)) and the year-to-date lows (YTD Low) as well as our scenarios for market and sector levels at the end of the current year (Forecast end 2020); 3) we compute return realizations over relevant horizons for our analysis: returns from the start of 2020 to the year-to-date worst level (YTW return), expected returns from year-to-date worst level to our end-of-year scenario level (WTE return), full-year scenario returns (Full 2020 return) and a High Low statistic that gives the ratio between the difference between our projected year-end levels and last-year lows to the difference between last-year highs and last-year lows. The latter can be used as a proxy for the recovery shape during 2020, assuming 2019 as a baseline for describing typical fluctuations of the market, i.e., if the ratio is close to one we can associate it with “V”-type recovery, while a negative value of the ration would be associated with an “L”-type scenario as populated in Table 2 below.
Table 2: U.S. Equity Sector Performance Scenarios
Insight/2020/07.2020/07.15.2020_StressTesting-QuantitativeAssessment/figure2.png)
Several observations stand out. First, the initial adverse shock to performance has not been homogenous. Some sectors (i.e., Consumer Staples, IT, Communication Services) have outperformed the broad market while others (i.e., Energy, Financials, Industrials) have contracted more sharply and deeply. Second, both the overall market and all individual equity sectors are still projected to be flashing red on a full-year basis. Third, our scenarios for sector behavior over the full year appear as varied as the initial downturn response. On the one hand, a clear pattern emerges that more defensive sectors (Consumer Staples, Utilities, Health Care) can be expected to be in the outperformer camp, both relative to other sectors and the broader market. Our scenario sees these sectors as slightly negative at year-end with substantial progress in recovering towards 2019 highs. Less defensive/more cyclical sectors (i.e., Energy, Consumer Discretionary, Financials, Industrials) are seen, through the lenses of this approach, to be in a weaker position with none expected to make a meaningful contribution towards achieving last year high levels. Next, we take a deeper look at the underlying dynamics behind our scenarios for a few interesting sector cases as each subjective scenario must also be plausible in terms of its economic justification and interpretable in terms of environment that can lead to its occurrence.
1.1 Case Study 1: Energy – A Road-Ahead View
Energy has undeniably been the hardest hit equity sector in the U.S. stock market, far underperforming not only the broad market but other sectors as well. The sector posted a sharply contractionary year-to-worst 61% negative return and our scenario points to the sector losing another 20% between the current-year low and the end of 2020. What could account for such a negative scenario? We turn to the underlying mechanics of our scenario generation framework and the underlying inputs for clues (please see conceptual appendix for a more detailed elaboration on the framework). As discussed in the conceptual description of the model, a key ingredient to our framework is our assumption about the level of the “risk-free” rate that is expected to prevail at our relevant scenario horizon and that investors would use as a benchmark to compare the attractiveness of other (more risky) investment opportunities. As of May 12, 2020, our FactSet economic forecasts indicate a consensus average view about an environment with higher interest rates at the end of 2020 with the 10-Year U.S. government bond yield, that we use as our “risk-free” benchmark, standing at 1.18% (higher than the level of around 70 basis points observed at the time of producing the report). This assumption for a better future income generation potential of the bond market already indicates pressure on riskier equity investment to deliver competitive yields to investors. The second important ingredient to our scenario framework is our assumption about the prevailing investor risk appetite at the relevant time horizon that drives investors’ asset allocation decisions. With an energy-sector equity risk premium scenario assumption for the end of 2020 of 4.53% our base case for the required energy-sector earnings yield at the end of the current year stands at around 5.7% implying a forward PE ratio expected at the end of 2020 of around 17.5. To put this scenario-based PE value into perspective, it is only slightly above the average forward PE ratio that the Energy sector materialized over the year of 2019. Thus, our framework does not indicate a material expected change in investor willingness to pay for a unit of forward-looking energy-sector earnings. Within our framework this leaves only one channel through which we can explain the projected additional underperformance in the Energy sector until the end of the current year: the level of forward earnings per share. Standing at around 8.2 at the end of 2021, analysts expect forward EPS to be nearly two and a half times lower for the Energy sector compared to earnings it generated at the end of 2019. Key takeaway: our scenario for a significant further drop in the sector is thus not necessarily a story of investor increased risk aversion or one of bond markets trumping the equity market. Instead, it is a story of significant downgrades in investor beliefs that in the current economic conditions the Energy sector would be able to generate a level of profitability that would warrant the exposure and the associated risk.
1.2 Case Study 2: Consumer Discretionary – A Scenario of an Elusive Recovery
The Consumer Discretionary has kept in line with the broader market in taking the initial adverse hit to performance avoiding the larger magnitudes of losses that other cyclical sectors witnessed (i.e., Industrials, Materials). Are there better days ahead? Our scenario provides a pessimistic answer to this question with our generated scenario of a 5% decline in this sector’s prices from the year’s low until the end of 2020, i.e., the second weakest worst-to-year-end (WTE) sector performance scenario and significantly weaker than the broad market on that metric. We perform the same decomposition analysis as before to gain insight into this expected dynamic. Looking at analysts’ estimates for EPS for the twelve-month period until the end of 2021 one can see that investors expect the sector’s earnings potential to remain robust: the forward EPS estimate for the end 2021 of around 37 stands only slightly below the trailing EPS of around 39 realized through to the end of 2019. Using a sector-specific assumption for the equity risk premium of around 4.3% that investors would require at the end of 2020 to have exposure to the Consumer Discretionary sector and using our baseline scenario for the risk-free rate of 1.18% at the end of 2020 generates an expected required sector earnings yield of around 5.5% - the return on investment needed to make exposure to the U.S. Consumer Discretionary sector equally attractive as holding the risk-free long-term government bond. Our scenario and assumptions thus imply a forward PE ratio of slightly above 18 at the end of 2020. This falls short of the average forward PE ratio of 21 realized through 2019. Key takeaway: the scenario projected underperformance in Consumer Discretionary until year end would be driven by investor reduced willingness to gain exposure to the sector and its earnings potential even in the context of robust expectations about this earnings potential. This could be explained to a significant degree by the amount of uncertainty currently surrounding the speed and time of the subsequent economic recovery.
1.3 Case Study 3: Utilities –A Winner Scenario?
In the aftermath of the market downturn, investors have been left searching for pockets of the market that may still deliver good return opportunities while offering a more defensive investment profile. We believe that such an opportunity may indeed have been found in a sector that is often overlooked in good times: Utilities. Our scenario analysis points to a 36% gain in the Utilities sector performance from the lowest year-to-date level until the end of 2020, i.e., far outpacing the broad market and, to a larger or smaller extent, all other equity sectors. Our analysis identifies two sources of why the performance of this sector may be expected to remain resilient until year end. First, the market expects a growth in earnings at the end of 2021 compared to realized earnings at the end of 2019 of 9%. This remains attractive in the current environment even in the presence of other sectors that are expected to deliver stronger earnings growth (i.e., IT, Health Care). Second, our scenario framework projects an expected required earnings yield from the sector at the end of 2020 of slightly above 5.5% that translates to a forward PE multiple of around 18. This is largely in line with investors’ willingness to pay for the sector’s earnings potential in 2019 when the average forward PE stood at 18.8. This should be further reinforced in the current environment where the search for safety in more defensive sectors can be expected to be sustained. Thus, there is currently little evidence to suggest that valuations may undermine the sector’s performance potential, both from a historical and cross-asset perspective. Key takeaway: our scenario can be interpreted as a case under which the Utilities sector appears to offer a balanced mix between expected earnings growth and valuations that are largely supportive.
2 Multi-Asset Class Scenarios and Assessing Model-Based Objective Probability of Consensus Estimates.
We base the majority of our financial market scenarios, presented in Table 3 below, on our internal FactSet Economic Estimates database. The FactSet Economic Estimates framework harnesses the power of rich surveys of professional forecasts (i.e., banks, asset managers, economic, and finance research institutes) to gain real-time and frequently updated consensus views on the future evolution of both important economic concepts and financial markets. In Table 3, we present the FactSet Economic Estimates consensus views as of May 12, 2020, for the likely path and destination of several major financial asset classes—foreign exchange, commodities, government bond and equities—at the end of the current year 2020. We elaborate briefly on the key points from our scenarios for each asset class.
Table 3: Multi-Asset Performance Scenarios
Insight/2020/07.2020/07.15.2020_StressTesting-QuantitativeAssessment/figure3.png)
Foreign exchange: Based on FactSet Economic Estimates, we see signs for an overall U.S. dollar weakness by the end of the calendar year vs. the major currencies that we have presented (Swiss Franc, Euro, Chinese Renminbi, UK Pound, and Japanese Yen). The dollar is seen as depreciating more strongly vs. the UK Pound (with the GBPUSD projected to stand at 1.29 at end 2020) and the Euro (with the EURUSD projected to be at 1.12 by year end). The consensus view is for the Japanese Yen to stage a more modest strengthening vs. the USD until end 2020 of less than 1% compared to current levels.
Commodities: FactSet economic survey, as of the date of the study, points to a reduced appetite for holding gold as a haven asset by the end of the current calendar year with a projected year-end level of 1598 $/ozt, down 6% from current levels. Energy markets are projected to rebound significantly by year end with Brent crude oil forecast to stand at around 40 $/bbl. at the end of 2020—a rebound of around 50% relative to levels observed around the bottom of the financial market downturn on March 23, 2020.
Government bonds: Except for Japan—where the central bank continues to maintain its “yield curve control” approach as part of its policy toolkit—FactSet consensus views , as of the date of the study, are for a higher yield environment at the end of 2020 across the rest of the major developed industrialized economies and relatively stable levels in China. We see a projection of a significant rebound in the backend of the U.S. government bond yield curve with the 10-Year benchmark bond yield standing at 1.18% at end 2020, up 50bps from current levels. The Estimates data points to the likelihood of a build-up of term premia in the U.S. long end of the curve by year end as policy measures start to get priced in even in the context of a highly accommodative central bank. A more muted rebound is projected for Eurozone government bond yields with the 10-Year German government bond expecting to yield a still negative 30bps by the end of 2020.
Equities: The Estimates data points to a likelihood for downside dynamics for the broad U.S. market by the end of the current calendar year relative to current levels. That postulates that valuations may restrain the market moves to the upside given expected bond market dynamics, especially in the context of little to no expected forward earnings growth. Brighter spots could be found elsewhere where we see some potential for positive returns until year end in Asia.
The question becomes, can we validate or at least judge on the feasibility of these scenarios by applying also a quantitative model-based approach? We do so by running FDS Monte-Carlo Risk Models at six-months horizon and seeking the scenarios with lowest distance to the projected Estimates Values. We illustrate the concept for the Rates and FX scenarios.
Charts 1 and 2 provide an illustration of the closest five and 100 realized simulations for the unconditional scenarios for the FX and Rates Respectively under the Fat-Tailed MC MAC approach and the Normal MC MAC Approach with 6Ms horizon.
Insight/2020/07.2020/07.15.2020_StressTesting-QuantitativeAssessment/figure4a.png)
Insight/2020/07.2020/07.15.2020_StressTesting-QuantitativeAssessment/figure4b.png)
Insight/2020/07.2020/07.15.2020_StressTesting-QuantitativeAssessment/figure4c.png)
Insight/2020/07.2020/07.15.2020_StressTesting-QuantitativeAssessment/figure4d.png)
Chart 1: (a) the FX Scenario and the closest five by Euclidian Distance scenarios via the Fat-tailed model; (b) the FX Scenario and the closest 100 by Euclidian Distance scenarios via the Fat-tailed model; (c) the FX Scenario and the closest five by Euclidian Distance scenarios via the Normal model; (d) the FX Scenario and the closest 100 by Euclidian Distance scenarios via the Normal model;
Chart 2: (a) the Rates Scenario and the closest five by Euclidian Distance scenarios via the Fat-tailed model; (b) the Rates Scenario and the closest 100 by Euclidian Distance scenarios via the Fat-tailed model; (c) the Rates Scenario and the closest five by Euclidian Distance scenarios via the Normal model; (d) the Rates Scenario and the closest 100 by Euclidian Distance scenarios via the Normal model;
The observation is that the FT approach provides scenarios being closer to the projected values.
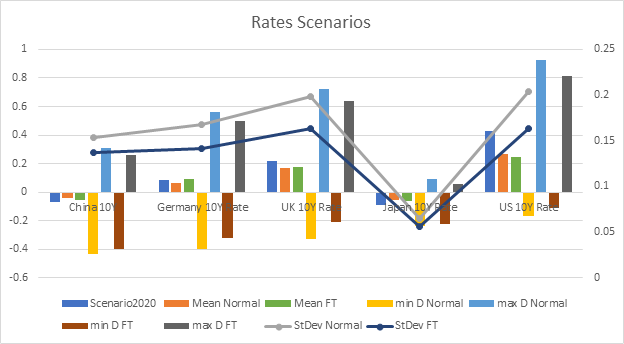
This is also confirmed when contrasting the standard deviations, averages, and min and max distance scenarios out of the closes 100 Monte-Carlo Scenarios as represented on Charts 3 and 4.
Chart 3: Standard deviations, Averages, and Min and Max Distance Scenarios Out of the Closest 100 Monte-Carlo Scenarios for FX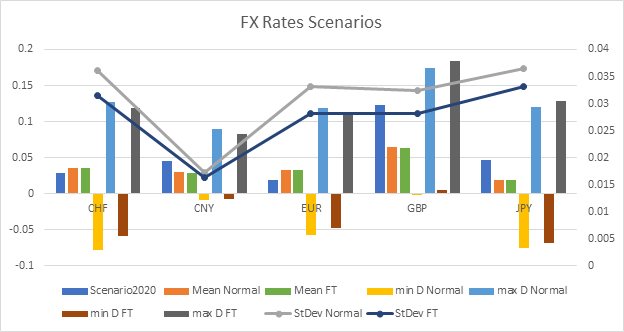
Chart 4: Standard Deviations, Averages, and Min and Max Distance Scenarios Out of the Closest 100 Monte-Carlo Scenarios for Rates
The feasibility analysis, as briefly presented above, could be used as a meaningful framework to assign weighting on the scenarios importance in case of analyzing multiple recovery scenarios and thus guide actionable insight in circumstances when projected scenarios allude to different portfolio hedging or reallocation decisions.
Finally, we implement the scenarios on a stand-alone and multivariate basis within FactSet’s Portfolio Analysis and study the impact over Russell 3000. The results are depicted on Chart 5 below.
Chart 5: Russell 3000 vs. U.S. Dollar Index - Stress Testing Percent Return Chart
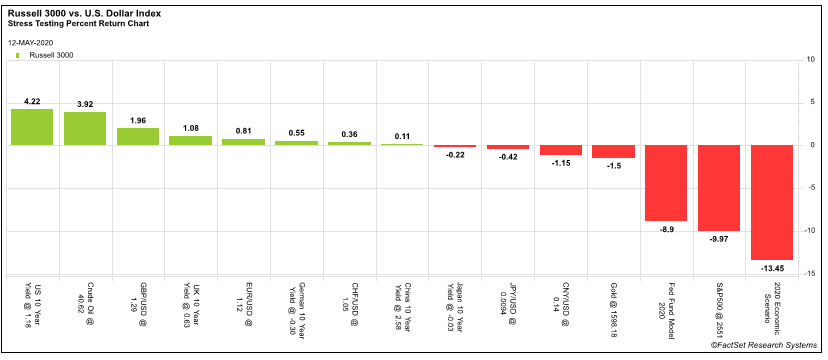
Leveraging FactSet’s flexible stress testing and scenario analysis functionality, we can easily model out the individual or multiple factor shocks to a portfolio to create hypothetical market environments or scenarios to understand the impacts and outcomes in each scenario. In the analysis below, we have taken each of the expected market outcomes from Table 3 and modeled them all in as individual correlated market shocks. In addition, we have created a 2020 Economic Scenario with all shocks happening for 2020, and lastly we have used a Fed Model (Table 2) to see the change in levels using expected change in the Index, U.S. 10 year yields, and the forward NTM earnings yield for the Russell 3000 using a consensus from FactSet estimates.
In the data below, we can see that most of the individual factor shocks have a minimal impact on the broad U.S. equity market outside of moves in the GBP/USD rates, crude oil, U.S. 10-year yield, and the composite market scenario shocks. The U.S. equity markets will be impacted most negatively by approximately a 13.5% move downward if all levels were to move to their projected outcome for 2020. According to the Fed model, the impact would be less severe being offset by the impact of the U.S. 10-year yields and the expected NTM earnings for the market facing a negative 9% move for the U.S. market.
Any of these scenarios can further be deployed using FactSet’s Portfolio Optimization and Asset Allocation tools to drive reallocation and reposition investment decisions. We will be providing further insight into this process in our next article of the COVID-19 Risk and Quant Series.
Understanding the implications of uncertainty is an integral part of decision-making. This has been especially highlighted in recent months with the COVID-19 pandemic being an exogenous shock of unprecedented nature to both the real economy and financial markets. In this report, we demonstrate how one can harness two separate instruments from the broader FactSet arsenal of data and technology capabilities—aggregate economic, financial views, and proprietary risk models—to paint a more comprehensive and realistic picture of complex endogenous systems such as financial markets. This unified approach can be of interest to both policymakers, who are concerned with financial conditions and their implications for the real economy, and to investors who need to formulate investment views in a rapidly evolving context.
Be Aware, Adapt, Innovate—or What We Learn from Mandelbrot, Noah, and COVID-19
By Dr. B. Racheva-Iotova
Part 1: VaR 99% and COVID-19: Back-Testing Studies on the FactSet Short-Term Risk Model Covering the Period of COVID-19 Outbreak
By Dr. B. Racheva-Iotova, Ivan Mitov PhD, Viviana Vieli, Velislav Bodurov
Part 3: Stress-testing and quantitative assessment of the probability of subjective stress scenarios
By Georgi Mitov PhD, Emil Margaritov PhD, Shamin Parikh, Dr. B. Racheva-Iotova
Part 4: Innovation: Multi-period optimization for long-term allocations incorporating stress-tests and investment objectives
By Georgi Mitov PhD, Ivo Stefanov, Chen Sui
Part 5: Minimum Tail Risk Smart-Beta
By Georgi Mitov PhD, Nikolay Radev, James Egginton

Dr. Boryana Racheva-Iotova is Senior Vice President, Senior Director of Research, Risk and Quantitative Analytics at FactSet. In this role, she leads the strategy for risk and quantitative analytics solutions that includes research, sales, and product development strategies. She is a co-founder of FinAnalytica and the former Global Head of Risk at BISAM and has over 15 years of experience in building risk and quant portfolio management software solutions. Before founding FinAnalytica, Dr. Racheva-Iotova led the implementation of a Monte-Carlo based VaR calculation to meet the Basel II requirements at SGZ Bank, as well as the development of six patented methodologies for FinAnalytica. In 2018, she received the Risk Professional of the Year Award from Waters Technology based on her achievements building risk management software solutions and translating the latest academic advancements in practical applications to meet the needs of financial industry practitioners. Dr. Racheva-Iotova earned a Master of Science in Probability and Statistics at Sofia University and a Doctor of Science from Ludwig Maximilian University of Munich.

Explore FactSet's insights on Israel-Iran conflict's market impact. Discover geopolitical risk analysis and stress testing to...
Understanding Regime Changes for Robustness in Backtesting
Explore how FactSet Programmatic Environment enhances backtesting by analyzing factor signal performance across different market...
Spikes in Market Volatility Through the Risk Model Lens
This April, financial markets around the world experienced levels of volatility comparable to several historical events. The...
Testing Investment Impacts from Rising U.S. Inflation and a Potential Recession
Given U.S. concerns of slowing economic growth and price hikes due to tariffs, in this article we perform a scenario analysis for...
The information contained in this article is not investment advice. FactSet does not endorse or recommend any investments and assumes no liability for any consequence relating directly or indirectly to any action or inaction taken based on the information contained in this article.
