Ever tried to figure out what industries are consolidating?
Investment managers and investment bankers alike have a lot to gain from accurate timing of industry consolidation. Deal advisors perhaps less so, because as we’ve already seen, deals are driven by people as often as economic forces.
Traditionally, industry analysis has focused on the change in volume or value of deals from one period to the next (month-over-month, quarter-over-quarter, year-over-year, etc.). That metric may tell you which industries are attracting deal activity and may give you an indication of the health of that industry, but that's about all comparable time periods can do with deals.
Lucky for us, with the content available on FactSet we can get a much better idea with some relatively simple queries across FactSet M&A and FactSet Entity Data Management Solutions (DMS).
The Setup
There are roughly 3 million companies in DMS and 600,000 deals in M&A. If we look at the number of companies in each industry, then look at the number of deals for companies in each industry by year, we can compare the two and see if the ratio of deals to companies highlights consolidating areas. In other words, if there are 1,000 widget makers in the world, but only five deals per year for those companies, that suggests that the industry for widget makers is fragmented and not consolidating.
The Basic Analysis
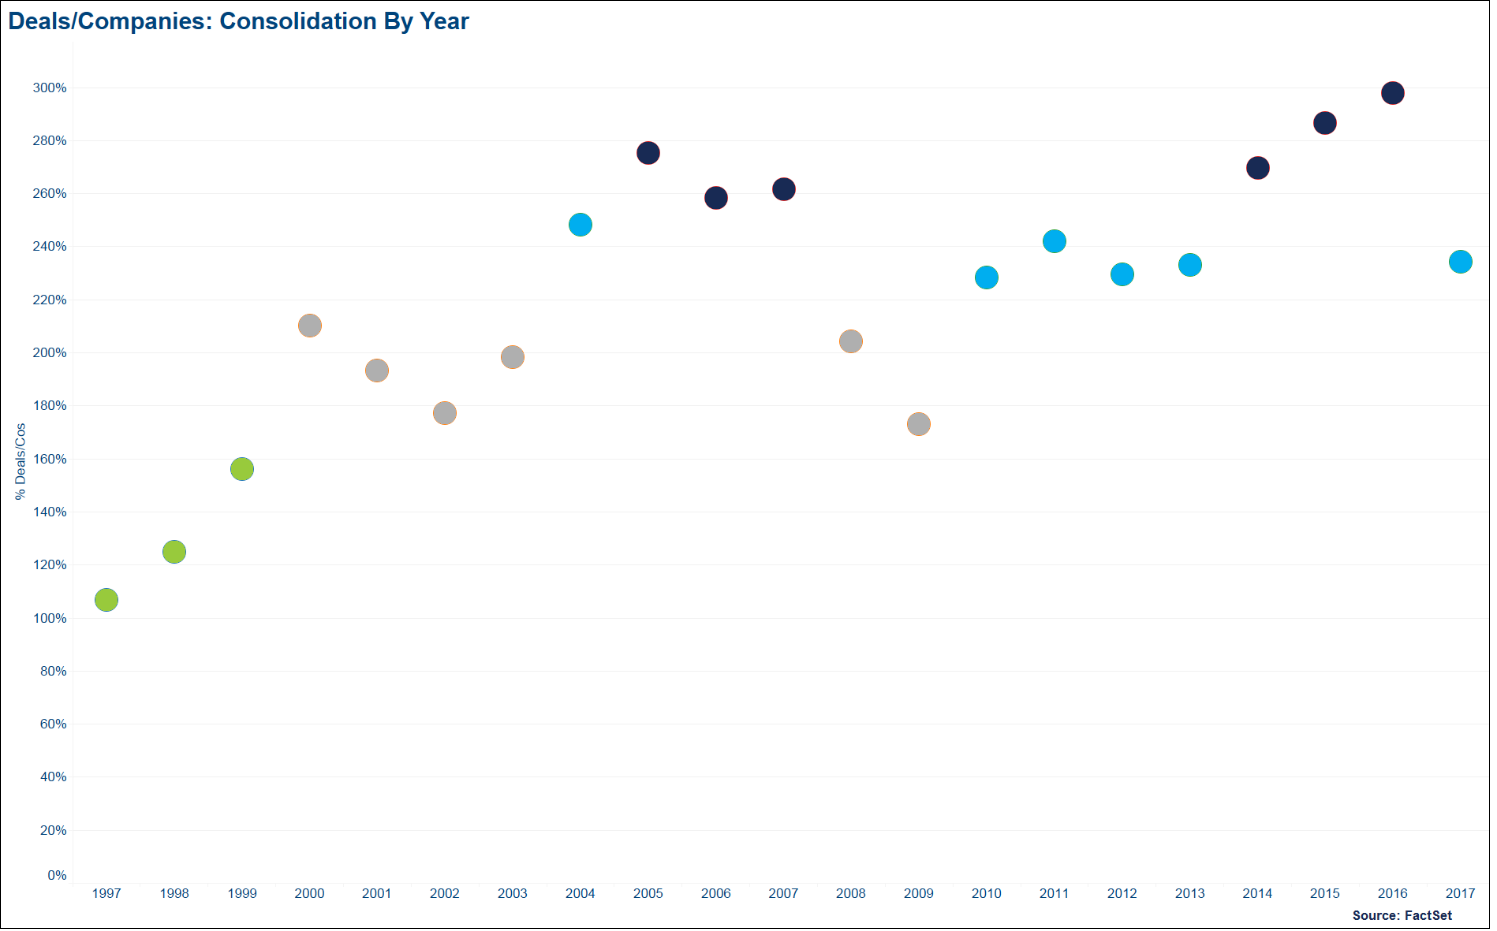
Looking at the ratio of deals to companies by year, you can see four main clusters, with the most recent three-year period comparable to the run-up to the financial crisis (lots of deals relative to companies).

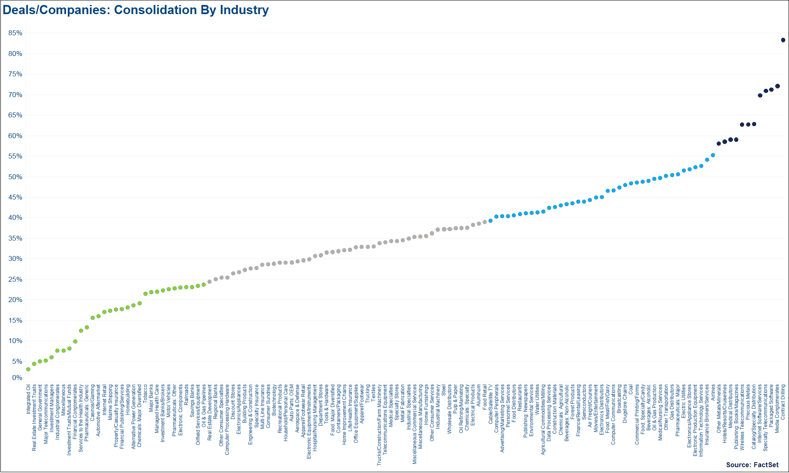
We can also look at the ratio of deals to companies by industry. Again, separated into four main clusters you can see a few industries that have a lot of deal activity relative to the number of companies, including Internet Software/Services, Prepackaged Software, and Contract Drilling.

The Final Analysis
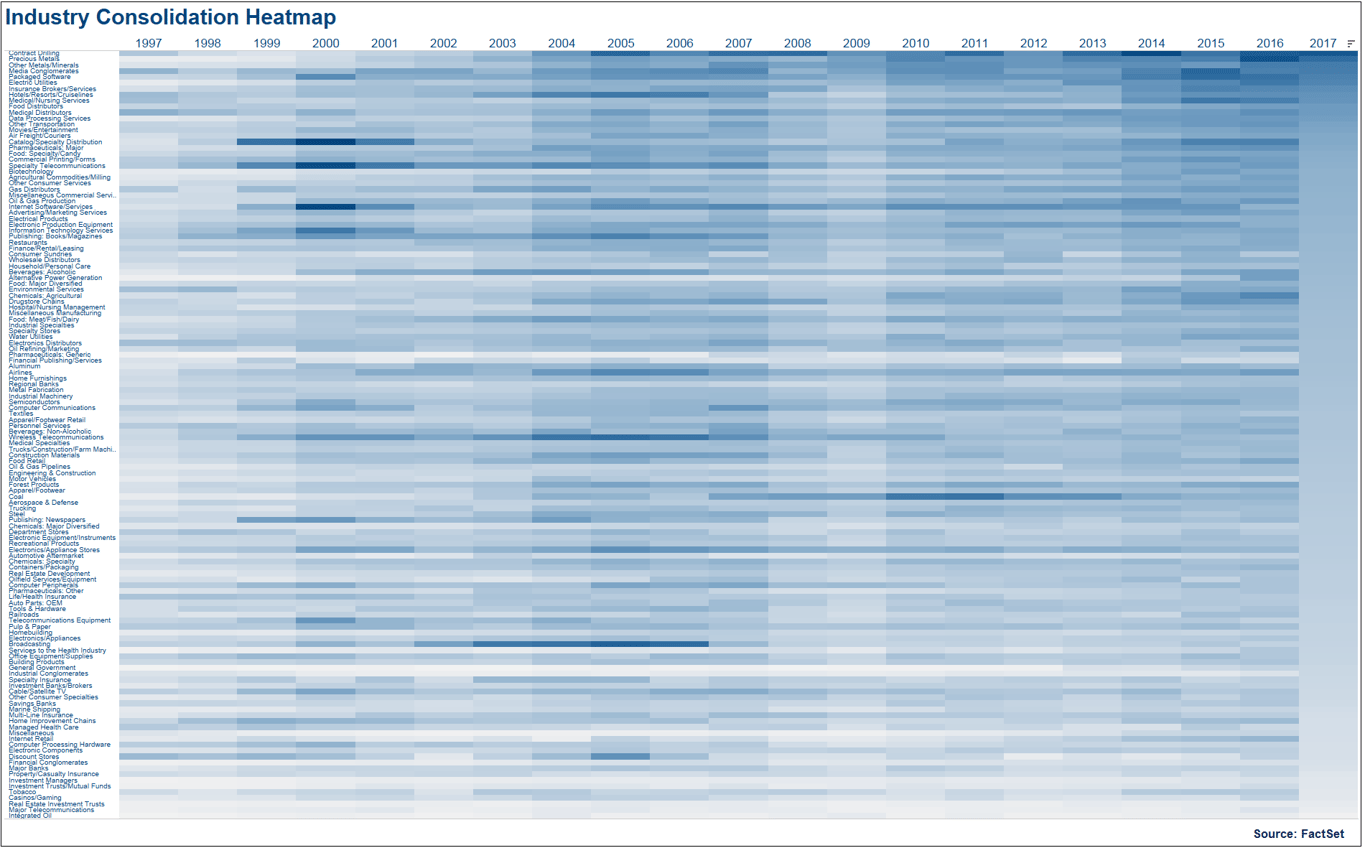
Combining the two, then, with the ratio of deals to companies annually for each industry, we get a nearly impossible-to-read heat map, sorted by 2017 results to show current consolidation. The darker shades indicate a higher ratio of deals to companies, or more consolidation in the industry. The visual may present some challenges (clicking to enlarge does help a bit), but you can still get a relatively clear idea of merger waves with darker verticals as well as clusters of industry activity that have driven or benefitted from those waves.

Finally, a Decent Visual
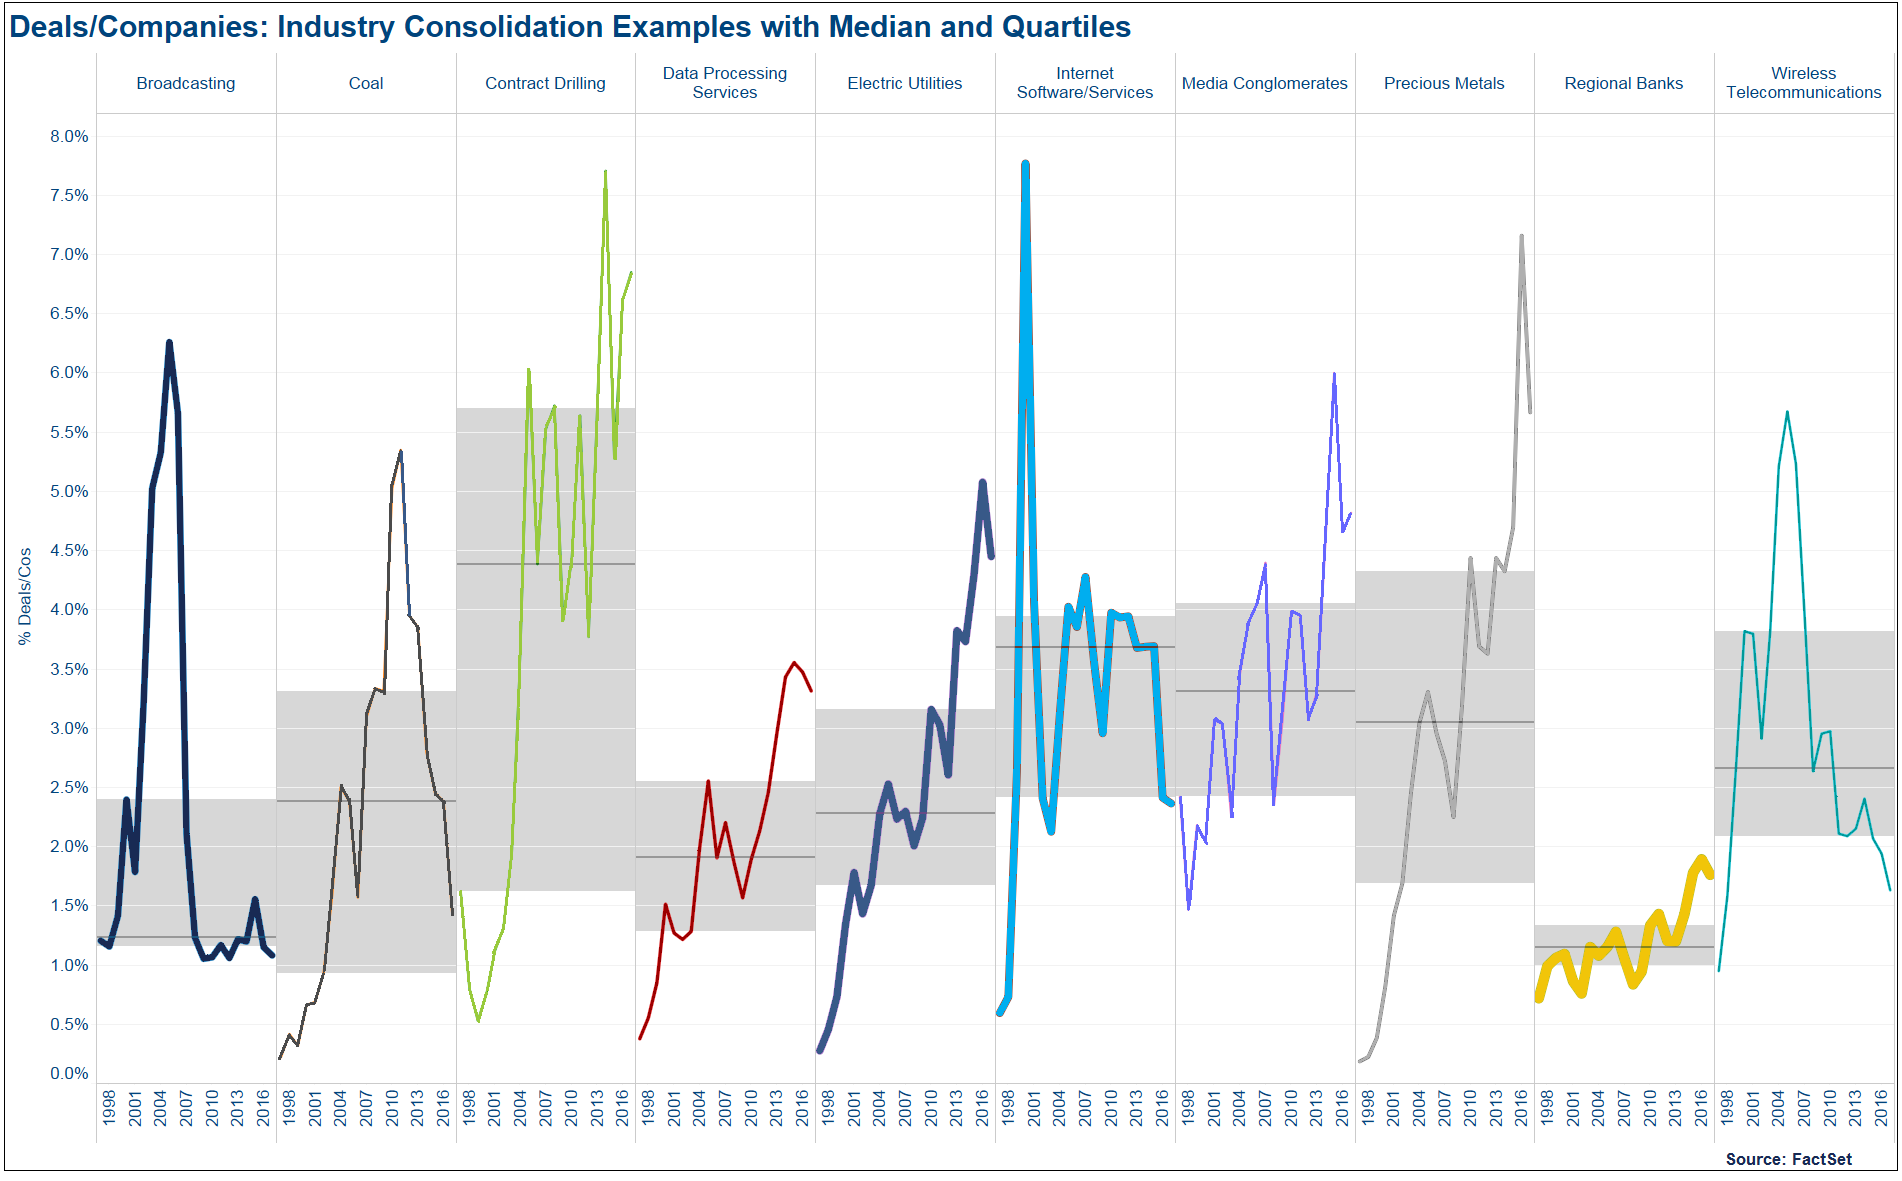
Given the lack of clarity in the heat map, below we’ve highlighted 10 industries so you can see the analysis in action. The thickness of the line indicates the relative number of companies in an industry (e.g., there are more Regional Banks than Media Conglomerates), and the median line is included as well as the quartiles to provide an indication of the strength of the activity. In this view, you can see the past bubbles in a few industries and the consolidation in others occurring now. The internet frenzy is clear in the early 2000s, followed by Broadcasting waves and Wireless Telecommunications consolidation a few years later.
Currently, Regional Banks are feeling pressure and joining forces, and Contract Drilling is on the rise, likely from the recent fracking boom.

What Next?
Further dividing the data by country or region may help highlight more specifics by location. However, with increasing globalization and interconnectedness, an industry consolidating in one part of the world could easily trigger consolidation elsewhere. Conversely, analysis at the sector level will widen the view.
Obviously, this analysis is imperfect. No one has a complete record of every single company in the world or every single deal over the last 20 years, so any analysis is more guideline than absolute. However, as a general indication of industry consolidation, this provides a much better view than a simple time period comparison.
Note the potential data bias in comparing the number of companies today against the number of deals historically. There may well be more companies created in an industry to take advantage of opportunity in that industry (creating a cycle of build/sell/consolidate/repeat), but given the patterns in this simple analysis those concerns may not be meaningful.
Where Does that Leave Us?
All investors — whether through PE/VC or public markets — would be wise to monitor deal activity in this way to avoid being caught in a bubble and overpaying. Conversely, those already in and looking to exit will not want to get caught outside the bubble and risk missing a profit-maximizing opportunity.
