With Italy’s constitutional referendum and French presidential elections over, it is time for investors to look forward to the next scenario of uncertainty in Europe.
Politically, 2017 could prove to be as active as 2016. This week, the United Kingdom will hold its next general election. Italy is also working on electoral reform and pushing for a vote this autumn, and Germany will also vote to elect members of the national parliament in September.
In the markets, commodities (particularly oil) are sluggish, equity markets are still in a general bull trend, and, due to monetary policies, inflation is slowly beginning to increase in almost all regions, even Europe. At the same time, ECB is not tapering interest rates, but may soon consider tightening them, another primary concern for investors, especially in the fixed income space.
Due to these ongoing political uncertainties, investors must properly monitor risk and performance to anticipate the correct counter measures to avoid investment losses and to capture opportunities.
Stress Testing for Uncertainty
The proxy portfolio we’ll use for analysis is based on the BofA Merrill Lynch Pan-Europe Government Index.
As of May 2017, grouping by currency, this portfolio is mainly exposed to the euro and British pound. Portfolio Effective Duration is roughly eight years three months and almost 12 years to the UK gilts component.
Under euro sovereign debt, there is an important exposure on peripheral countries and spread risk due to Italy and Spain.
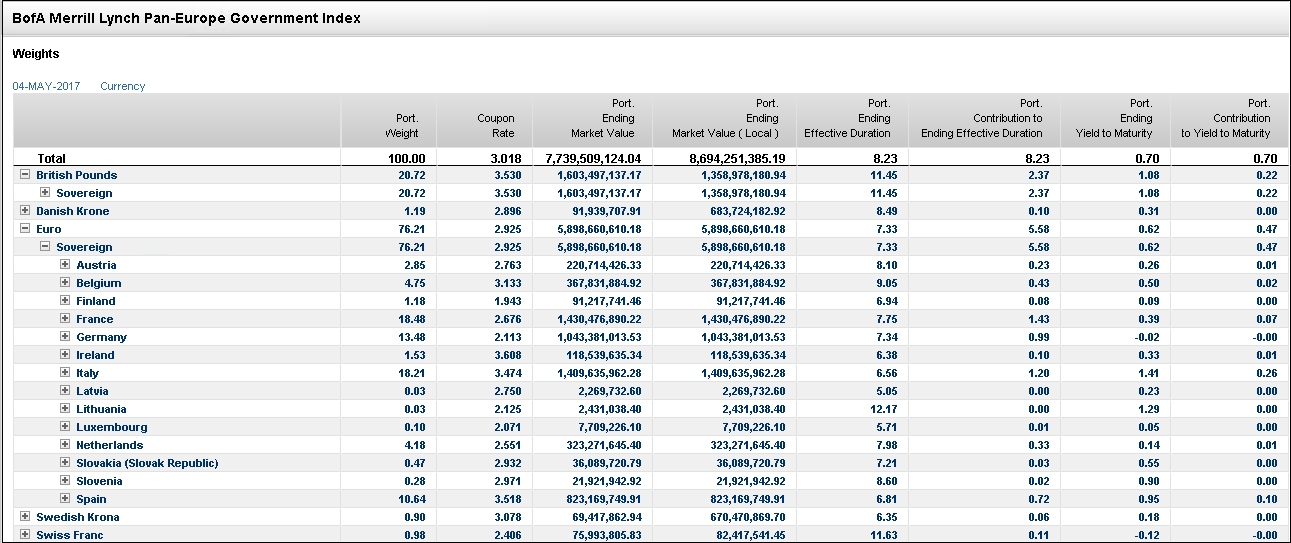
By looking more closely at fixed income sensitivities, we see the portfolio is mainly exposed to the long part of the curve, for both euro and British pound curves.

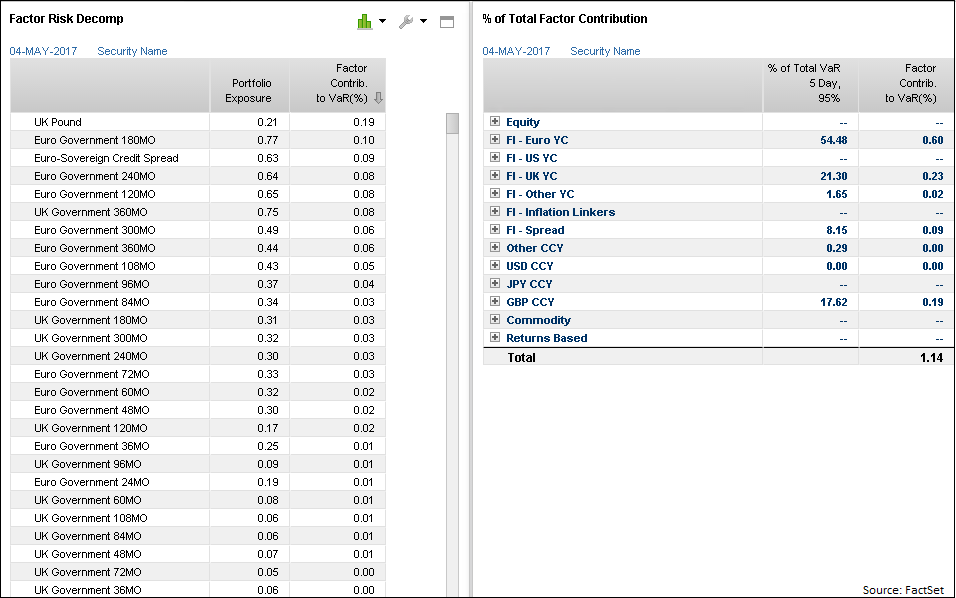
According to FactSet’s multi-asset class risk model, the VaR 5-Day 95% (systematic risk) is 1.14%. This is explained by 54.48% of VaR due to the euro yield curve factor exposure, 21.30% of VaR due to the UK yield curve factor exposure, and 17.62% of VaR due to GBP exposure.
By looking at single-factor exposures, we see the UK pound is the top contributor to VaR in absolute term (almost 0.19 of 1.14), followed by the exposure to the 15Y Euro Yield Curve tenor (0.10 of 1.14) and the exposure Euro-Sovereign Credit Risk (0.09 of 1.14), among others.
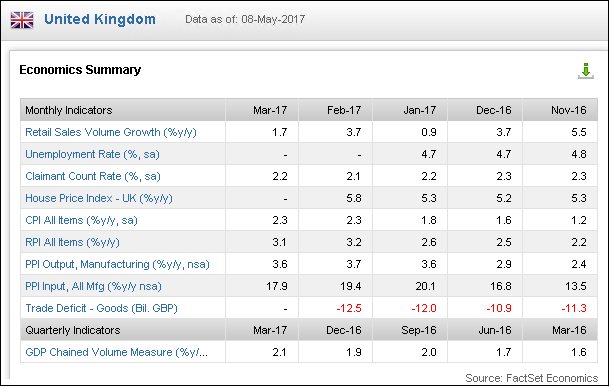
Among ongoing political risks, there is concern about the future of the United Kingdom and continued Brexit effects. Furthermore, with GBP depreciation following the Brexit vote, our portfolio is exposed to currency risk along with interest rate risk.
UK inflation has passed the 2% threshold, which may cause the Bank of England to raise interest rates. However, it seems that consumers have also reduced their spending, which could hurt GDP growth, generating a big headache for the Bank of England.
All told, we assume ECB is not going to tighten in the near future.
Based on those assumptions, and our previous analysis, we can more readily evaluate portfolio risk.
To hedge both interest rate risk and currency risk on GBP, we’ve modelled a cross-currency swap becoming the payer of a fixed GBP leg (swap rate of 3.5%) and the receiver of a floating euro leg (based on EURIBOR three-months, quarterly reset).
To hedge the credit spread risk, we can buy protection through modelling a Credit Default Index based on the Markit CDX iTraxx SOVX Western Europe.
In doing so, we see portfolio duration decreases from the previous level of 8.23 to 4.68 (less than five years), and we’re able to neutralize GBP exposure.
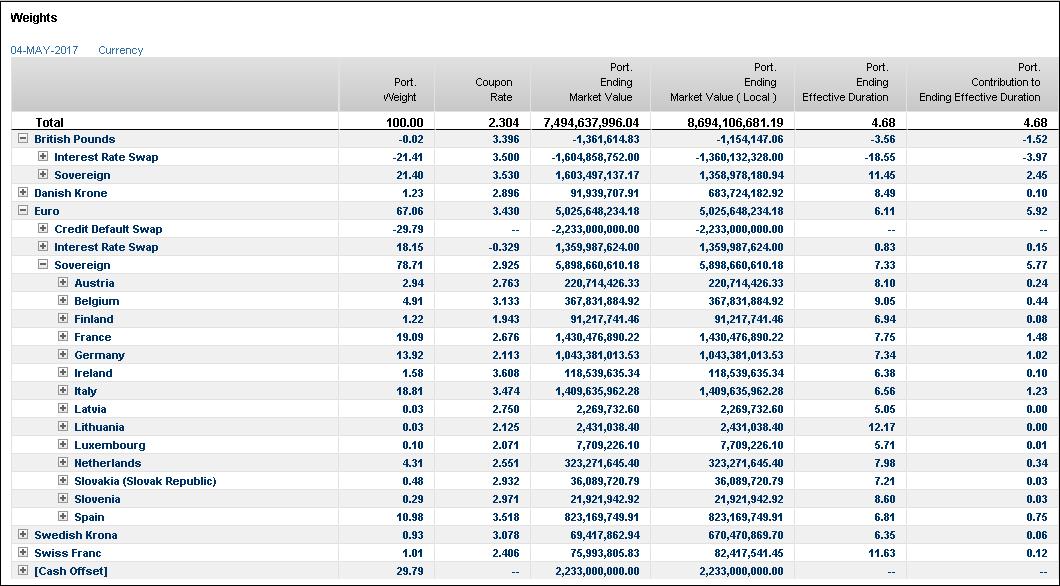
By looking at Partial Duration, the hedging operation seems to display the expected behavior. We are now able to synthetically modify our interest rate exposure on the long part of the GBP yield curve.

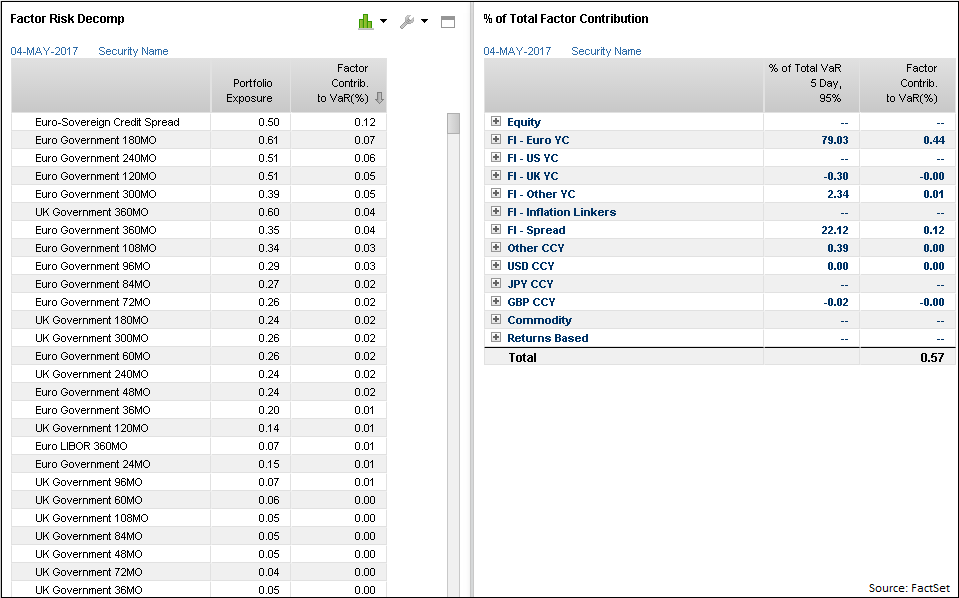
To analyze risk and confirm our first insight we again turn to FactSet’s multi-asset class model. Here are the results:
- Overall Portfolio VaR decreased from the 1.14% to the .57%, which indicates our hedging strategies are working as intended.
- GBP CCY exposure has been neutralized (from the previous contribution of 0.19% to the near 0% after hedging). FI–UK YC (exposure to the UK yield curve) has been almost neutralized as well. Contribution to VaR is now almost 0%, from the previous level of 0.23%.
Due to the exposure rebase, we are more exposed to euro interest rate and credit spread risk; however, due to the cross currency swap, the floating receiving leg lets us reduce the interest rate risk to the euro. It is now 0.44%, compared to the previous 0.60%
Even if the contribution to VaR of the euro credit spread increased a bit, using this method we are still able to reduce the exposure from the previous level of 0.63 to 0.50.
With uncertainty continuing in Europe, this kind of analysis is increasingly critical for investors. Such instruments allow us to investigate each component of our risk exposure and determine what is required to avoid losses and capture opportunities.
