While all US companies report EPS on a GAAP (generally accepted accounting principles) basis, many US companies also choose to report EPS on a non-GAAP basis. There are mixed opinions in the market about the reporting of non-GAAP EPS by US corporations. Supporters of the practice argue that it provides the market with a more accurate picture of earnings from the day-to-day operations of companies, as items that the companies deem to be one-time events or non-operating in nature are typically excluded from the non-GAAP EPS numbers.Critics argue that there is no industry-standard definition of non-GAAP EPS, and companies can take advantage of the lack of standards to (more often than not) exclude items that have a negative impact on earnings in order to boost non-GAAP EPS.

As of today, all of the companies in the Dow Jones Industrial Average (DJIA) have reported EPS for FY 2015. What percentage of these companies reported non-GAAP EPS for FY 2015? What was the average difference between non-GAAP EPS and GAAP EPS for companies in the DJIA for FY 2015? How did this difference compare to last year?

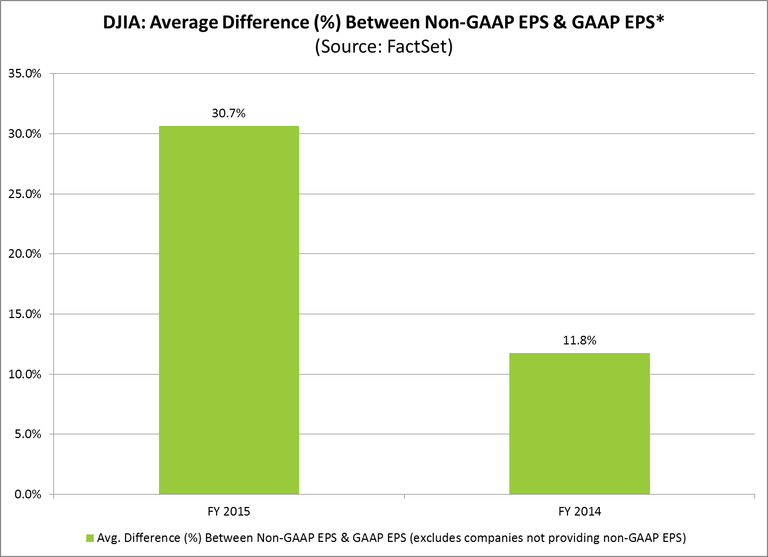
For FY 2015, 20 of the 30 companies in the DJIA (or 67%) reported non-GAAP EPS in addition to GAAP EPS for the fiscal year. For 18 of these 20 companies, non-GAAP EPS was higher than GAAP EPS for. On average, non-GAAP EPS exceeded GAAP EPS by 30.7% for these 20 companies. For FY 2014, 19 of the 30 companies in the DJIA (or 63%) reported non-GAAP EPS in addition to GAAP EPS for the fiscal year. For 15 these 19 companies, non-GAAP EPS was higher than GAAP EPS. On average, non-GAAP EPS exceeded GAAP EPS by 11.8% for these 19 companies. Thus, there was a wider gap on average between non-GAAP EPS and GAAP EPS in FY 2015 compared to FY 2014 for companies in the DJIA.
DJIA: Top 5 Companies With Widest Gap Between Non-GAAP EPS and GAAP EPS for FY 2015
| Company |
Ticker |
Non-GAAP EPS |
GAAP EPS |
Difference (%) |
| Merck & Co., Inc. |
MRK |
3.59 |
1.56 |
130.1% |
| General Electric Company |
GE |
0.35 |
0.17 |
105.9% |
| Microsoft Corporation |
MSFT |
2.63 |
1.48 |
77.7% |
| Pfizer Inc. |
PFE |
2.20 |
1.24 |
77.4% |
| United Technologies Corporation |
UTX |
6.30 |
4.53 |
39.1% |
GAAP EPS and Non-GAAP EPS from Continuing Operations were used in calculations when provided
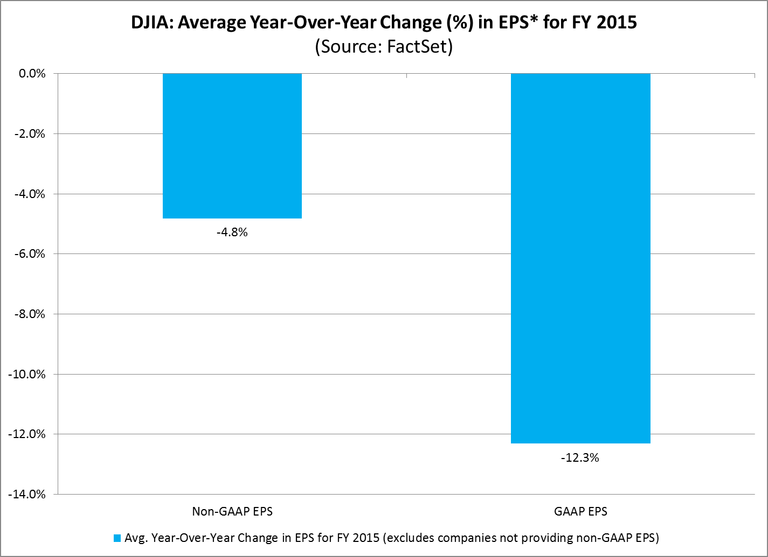
Due in part to this wider gap between non-GAAP EPS and GAAP EPS, companies in the DJIA on average reported a much smaller year-over-year decline in year-over-year EPS on a non-GAAP basis than on a GAAP basis for the year. For FY 2015, the 20 companies in the DJIA that reported non-GAAP EPS reported an average year-over-year decline in non-GAAP EPS of -4.8%. These same 20 companies reported an average year-over-year decline in GAAP EPS of -12.3%.
