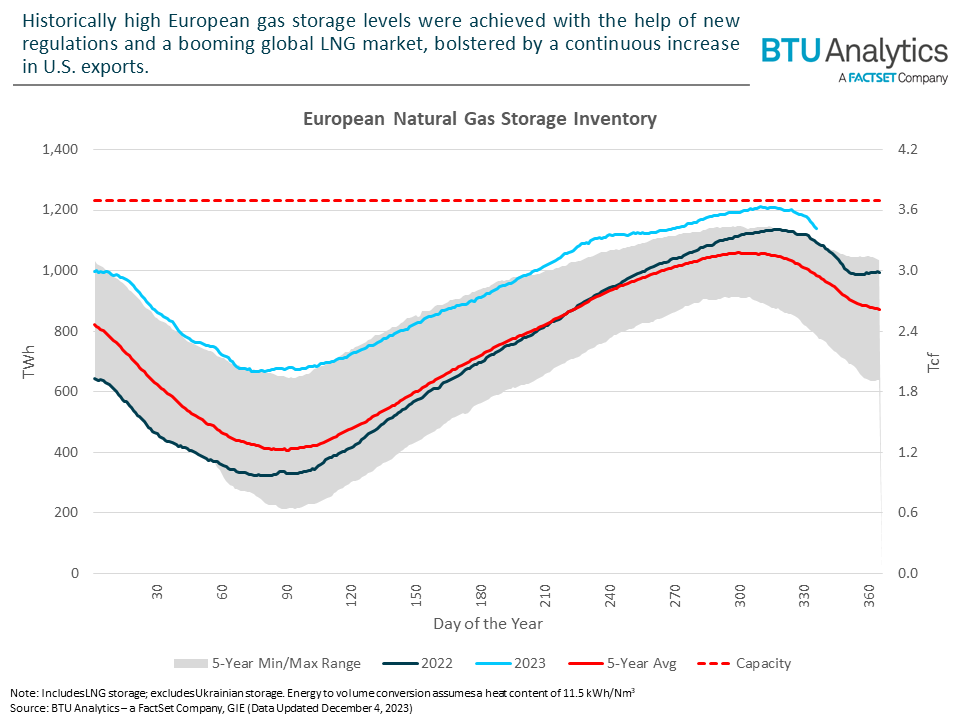
December is off to a chilly start in Europe, with the first sub-freezing temperatures of the season hitting European capitals. Thanks to these colder temperatures, heating demand is on the rise, which has caused natural gas storage operators to tap into their inventories and begin the withdrawal season, albeit a few weeks late compared to the last five years. While historically high inventories will put downward pressure on pricing, recent history has shown that Euro-Russian tensions tend to bring accidental or unexplained infrastructure incidents.
Natural gas facility-level storage and pipeline flow data discussed in this Insight are available to FactSet clients here.
The new EU regulation passed in Summer 2022 aimed at bolstering gas storage inventories, coupled with the expansion of LNG import infrastructure, contributed to filling European storage at a historically fast rate. This rapid inventory build, aided by the continuing boom in U.S. LNG exports, meant that by the time the region entered this heating season, inventories had reached 98% capacity.

In addition to its network of underground and LNG storage, shown in the map below, Europe has expanded its ability to import additional supply with the commissioning of nine new import facilities in the past two years. The newly commissioned facilities imported 153 TWh (470 Bcf) of additional supply this year.
Insight/2023/12.2023/12.06.2023_Energy/map-of-european-gas-infrastructure.png?width=960&height=672&name=map-of-european-gas-infrastructure.png)
While the supply outlook this winter has seen year-over-year improvement, the map also highlights the precarious nature of the situation by showing two recent infrastructure outages in the Baltic Sea. First, the Nord Stream outage in September 2022, which ruptured three out of the four pipelines of Nord Stream 1 and 2, was a significant setback, taking about 1.7 TWh/d (5.2 Bcf/d) of supply offline. This came on the heels of the cessation of supply via the Yamal pipeline, delivering two successive blows to European supply. Imports from the east dropped dramatically, from approximately 5.6 TWh/d (17.5 Bcf/d) to approximately 1.5 TWh/d (4.7 Bcf/d) today. Even at these reduced volumes, Russian gas still makes its way to Europe via Turkey using TurkStream and Blue Stream.
Insight/2023/12.2023/12.06.2023_Energy/european-natural-gas-imports-by-country.png?width=960&height=720&name=european-natural-gas-imports-by-country.png)
These disruptions were felt by the entire region and pushed the EU to adopt its current measures that put a focus on storage inventories and, indirectly, LNG regasification infrastructure. However, the more recent outage on the Balticconnector, provides a more geographically narrow risk and shows how some regions may be isolated from the rest of Europe without key pieces of infrastructure. The graphic below shows the flow on the Balticconnector up until its outage on October 8. With the startup of the Inkoo FSRU west of Helsinki, the flow on the pipe was able to be consistently reversed towards Estonia thanks to imported cargos from the United States.
Insight/2023/12.2023/12.06.2023_Energy/balticconnector-flows-and-finnish-lng-imports.png?width=960&height=720&name=balticconnector-flows-and-finnish-lng-imports.png)
This connection also provided one of the few links for Finland to the rest of the continent. With the Balticconnector’s disruption likely to extend well into 2024, Finland is solely reliant on its two southern LNG import facilities. Rising Finnish-Russian tensions brought on by Finland joining NATO have coincided with the suspicious incident around the Balticconnector and the closing of Finland’s 1,340 km (833 mi) border with Russia. Once reliant almost solely on Russian gas, Finland now relies on LNG imports mainly from the U.S. to serve its demand, much like the rest of the region.
Natural gas facility-level storage and pipeline flow data discussed in this Insight are available to FactSet clients here.
Throughout this winter we will continue to track developments in the region and how the European natural gas grid copes with low temperatures. Check back here for more analysis and data on European natural gas supply, demand, transportation, and pricing.
BTU Analytics is a FactSet Company. This article was originally published on the BTU Analytics website.
This blog post is for informational purposes only. The information contained in this blog post is not legal, tax, or investment advice. FactSet does not endorse or recommend any investments and assumes no liability for any consequence relating directly or indirectly to any action or inaction taken based on the information contained in this article.
