
Between January 2022 and May 2026, European defence equities produced one of the strongest structural reratings of the past decade, yet much of it was not captured by conventional sector classification, benchmark membership, or ESG screening. The large prime contractors were identified, classified, and held. A wide set of the companies that rerated alongside them, in several cases more strongly, were not. Those same conventional lenses did not classify them as defence exposure, even as a growing share of their revenue depended on it.
The cost of that gap is clearest in the dispersion of returns. Within a single sector classification, full-period returns ran from more than 700% to about −90%, a spread of over 800 percentage points between the best and worst performers. Membership of “Aerospace & Defense” told an investor little about which of those outcomes a portfolio actually held.
These returns were not confined to a few exceptional cases. Across the full population of European defence-manufacturing companies, the median name returned roughly twice the global benchmark over the period, though the range around that median was very wide. The strongest performers were often the companies hardest to identify through a sector lens.
Saab returned 921% over the period, OHB 1,211%, Exail Technologies 768%, and Lubawa 744% in local-currency total-return terms, against 61% for the MSCI ACWI. These were satellite operators, navigation and electronics specialists, and secure-communications businesses; not the large, widely followed prime contractors.
This article works through four FactSet datasets, RBICS at Level 6, ESG Thematics, Geographic Revenue Exposure (GeoRev) and Supply Chain Relationships, to show why conventional classification missed these companies, why it mattered for investors, and what it implies for 2026. As the initial rerating matures, the work shifts from screening for exposure toward monitoring whether it still holds.
European defence equities produced one of the strongest structural reratings of the past decade. The more interesting question is not why defence outperformed, but why some of the strongest returns came from companies that traditional sector classifications, benchmark methodologies, and ESG screens did not consistently identify as defence businesses.
Between January 2022 and May 2026, a range of European defence-related companies delivered returns above those of the large prime contractors, among them satellite operators and firms supplying navigation systems, defence electronics, communications equipment, and specialised components. In many cases they sat outside the benchmarks, sector screens, and thematic products through which institutional investors typically access the theme.
The explanation is not simply that investors underestimated defence spending. Markets recognised the implications of higher NATO budgets, Germany’s special defence fund, and the acceleration of procurement programmes across Europe fairly quickly. What proved harder to pin down was where that spending would ultimately flow, and the reason lies in the nature of the theme.
Defence behaves less like a single sector than like an industrial ecosystem, in which money from rising military budgets moves through prime contractors, specialist manufacturers, software providers, satellite operators, electronics suppliers, and engineering firms. Conventional classification picks up the prime contractors. It is less suited to identifying the rest.
Using FactSet RBICS, ESG Thematics, Geographic Revenue Exposure (GeoRev), and Supply Chain Relationships data, this article looks at how that gap emerged, why it mattered for investors, and what it suggests about identifying defence exposure today.
The scale of the rerating is easiest to appreciate through the returns themselves. Between January 2022 and May 2026, Saab AB returned 921% in local-currency total-return terms. (Saab AB, ticker SAAB.B-SE, FactSet entity ID 0033BD-E. Swedish combat aircraft, naval systems and airborne surveillance.) OHB SE returned 1,211%. (OHB SE, ticker OHB-DE, FactSet entity ID 05J5SQ-E. German satellite and space-systems integrator.) Exail Technologies returned 768%. (Exail Technologies, ticker EXA-FR, FactSet entity ID 05PQ3D-E. French inertial navigation systems and autonomous underwater vehicles.) Lubawa SA returned 744%. (Lubawa SA, ticker LBW-PL, FactSet entity ID 062521-E. Polish manufacturer of ballistic protection, military textiles, and load-bearing and camouflage equipment.) Over the same period the MSCI ACWI returned 61%. (iShares MSCI ACWI, ticker ISAC-GB, FactSet entity ID 04H1CF-E.)
(All returns are total returns sourced from FactSet Prices, calculated in each security's local trading currency with dividends reinvested. Returns are not FX-adjusted and therefore reflect equity performance in local currency terms rather than investor returns in a common base currency. Time-series returns are calculated on a point-to-point total return basis over the stated period unless otherwise specified. Past performance is not indicative of future results.)
The table below presents annualised risk and return statistics for the named securities.
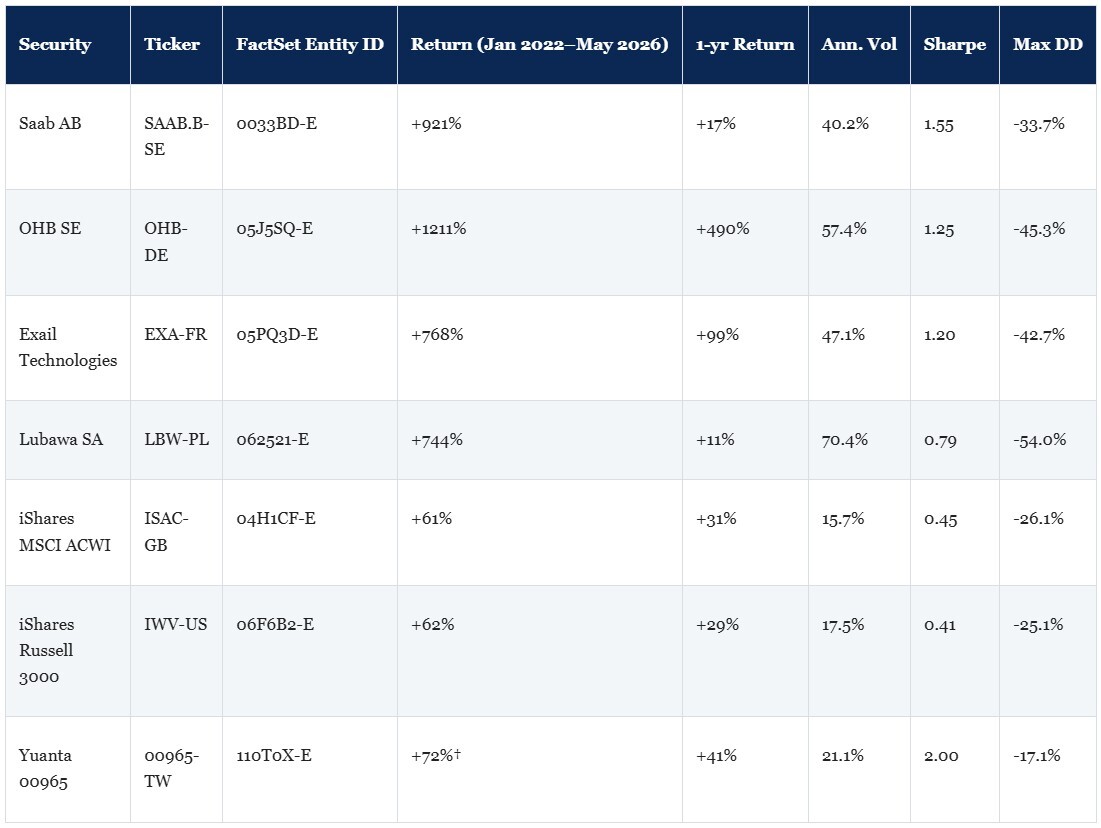
Source: FactSet Prices, total return, dividends reinvested, local currency, all equities and benchmark ETFs; FactSet ETF data for Yuanta 00965, NAV total return TWD. Full period: 3 January 2022 to 31 May 2026, approximately 4 1/3 years. 1-year: 31 May 2025 to 31 May 2026. Ann. vol: standard deviation of daily returns multiplied by sqrt(252). Sharpe ratio uses a 4.0% per annum risk-free rate assumption; annualised return is geometric mean CAGR, not arithmetic mean; calculated as (CAGR − 4%) ÷ ann. vol. Max drawdown covers the full January 2022 to May 2026 window, peak to trough. † Yuanta 00965 return is inception-to-date, November 2024 to May 2026, approximately 17 months, not a full-period figure; Sharpe and volatility for Yuanta are based on the same short window and carry high estimation error. All returns in local currency. Past performance is not indicative of future results.
These returns are often put down to a simple recovery in defence valuations after years of underinvestment, and valuations were certainly depressed entering 2022. European defence companies had spent much of the previous decade trading at a discount to broader industrial markets as procurement budgets stagnated across the region.
A recovery alone, though, does not account for how long the move lasted. It extended through 2023, 2024 and into 2025 as governments turned policy commitments into multi-year procurement programmes. Germany established its EUR 100 billion special defence fund, announced shortly after Russia’s full-scale invasion of Ukraine on 24 February 2022. Poland raised defence spending above 4% of GDP, the highest in NATO at the time, and Sweden joined NATO in March 2024.
Across Europe, contracted demand and revenue visibility improved. A US-Iran escalation in February 2026 added a further round of munitions replenishment orders across the alliance, as the conflict drew down US missile inventories and exposed the vulnerability of conventional platforms to low-cost drones, pulling forward European procurement decisions on both fronts.
What set this cycle apart from many earlier defence rallies was the breadth of participation. The large prime contractors benefited first, but over time the gains extended to specialised suppliers, electronics manufacturers, satellite companies, and other businesses with less obvious links to defence spending.
That progression is the analytical challenge at the heart of this article: Investors who defined the theme through conventional sector classifications captured the primes, while those who looked at revenue sources, product exposure, and supply relationships could see a wider set of beneficiaries.
Independent benchmarks track the same shift. The VanEck Defence ETF (DFNS, London Stock Exchange), launched in March 2023, returned +232.2% from inception through May 2026, against +85.7% for the iShares MSCI ACWI over the same window. (FactSet ETF data, NAV total return, USD; FactSet Prices, total return.) HANetf’s Future of Defence ETF (NATO, London Stock Exchange), launched in July 2023, returned +178.3% from inception through May 2026. (FactSet ETF data, NAV total return, USD.) WisdomTree Europe Defence (WDEF) and the Future of European Defence ETF (ARMY), both launched in early 2025, tracked the same direction.
The pace of new launches, from those two in early 2025 to the KIM ACE 0102X0 listing in Seoul in September 2025, reflects demand catching up with a theme that lacked dedicated vehicles at the start of the cycle. Global dedicated defence ETF assets grew from near zero in early 2022 to over $14 billion by end-2025. (FactSet ETF data; scope: post-2022 thematic dedicated defence ETFs, FX-converted to USD as of 31 December 2025; the broader Aerospace and Defense ETF universe, including pre-existing diversified funds and leveraged or inverse single-stock products, is materially larger.)
The performance gap raises a straightforward question. If defence spending became one of the most important investment themes in Europe after 2022, why were several of the strongest beneficiaries absent from so many investors’ screens, benchmarks, and thematic allocations? Part of the answer lies in how investment universes are built. Most classification systems assign a company to a single primary industry based on its dominant source of revenue. That works well for broad sector allocation and index construction, but it is less useful when a theme cuts across several industries, and defence is exactly such a theme.
A combat aircraft manufacturer is easy to place. A satellite operator holding government reconnaissance contracts is less obvious. A communications company supplying encrypted tactical networks may sit under a technology label despite earning a meaningful share of its revenue from defence customers, and a components firm making parts for missile systems may sit in an industrial category next to businesses with no defence exposure.
Companies caught up in the same procurement cycle can end up in entirely different sectors and peer groups. As European spending accelerated, the money did not flow only to prime contractors. It moved through a wider group of electronics, software, navigation, sensor, and space companies, many of which earned real defence revenue while carrying classifications that gave little sign of it.
To see whether the strongest performers were a few exceptional names or part of a wider pattern, we took the full population of RBICS Level 6 defence-manufacturing companies and sorted them by the share of revenue they earn in European markets, measured on FactSet GeoRev.
The relationship is consistent. The quarter of companies with almost no European revenue had a median return below the benchmark and fewer than a third beat it. Each step up in European revenue exposure brought a higher median return and a higher share of companies ahead of the benchmark, and the most European-facing quarter returned a median of about 140%, more than twice the 61% of the MSCI ACWI, with roughly 7 in 10 beating it.
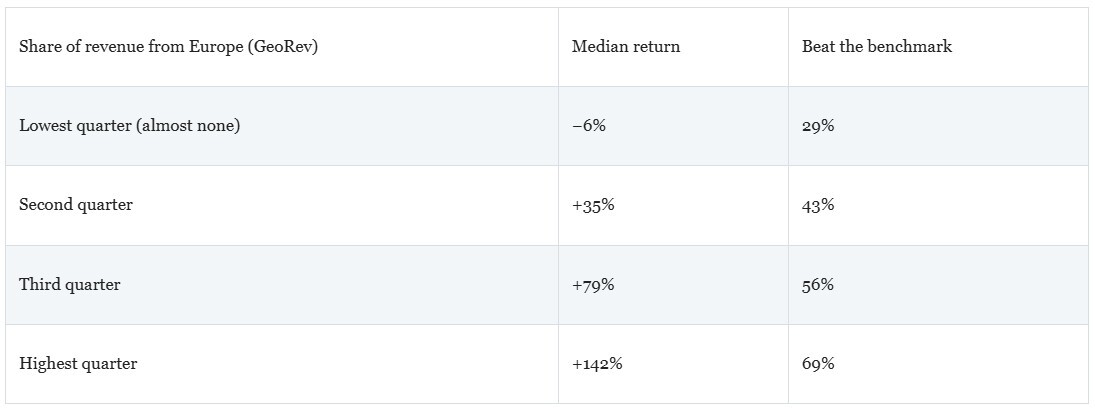
Source: FactSet Prices and FactSet Geographic Revenue. Population: RBICS Level 6 Aerospace and Defense Manufacturing companies with at least 500 trading days of history, 3 January 2022 to 31 May 2026, local-currency total return, grouped into four equal bands by European revenue share. This describes returns over the period and is not a trading rule. Past performance is not indicative of future results.
This is where revenue geography earns its place. Two companies can carry the same defence classification yet sit at opposite ends of that range, because one sells into European procurement and the other does not. Country of domicile or listing will not separate them. Revenue geography will, and in a cycle paid for out of European budgets that distinction did much of the work.
The same companies show why the sector label alone was of little help. Within one RBICS Level 3 category, Aerospace and Defense Manufacturing, the range of outcomes was very wide. MS International returned more than 700% over the period, while Latécoère, which carries the same Level 3 classification, lost about 90%. A portfolio built from the label would have held both, with nothing in the classification to tell them apart.
Drop to RBICS Level 6 and the picture separates. The defence-focused sub-sectors such as combat systems and defence electronics sit well clear of the civil-facing ones such as aerostructures, where revenue follows the commercial-aviation cycle rather than defence budgets. That's a connection FactSet Supply Chain Relationships records and that this article takes up in Section 6. The named companies here are illustrations of that spread, not a representative sample.
Figure 1 shows full-period total returns for the beyond-prime defence companies discussed here.
European Defence Companies Beyond the Primes: Full-Period Total Return
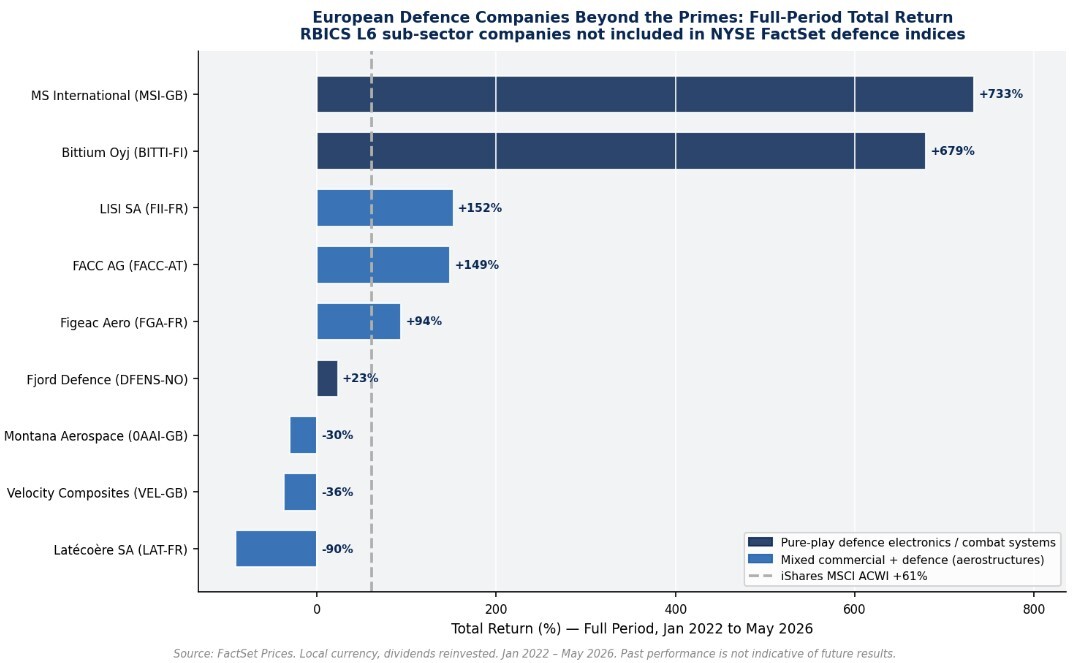
Figure 1 — European Defence Companies Beyond the Primes: Full-Period Total Return (Jan 2022–May 2026). Companies classified in RBICS Level 6 beyond-prime defence sub-sectors, not included in NYSE FactSet defence indices. Source: FactSet Prices. Local currency, dividends reinvested. Past performance is not indicative of future results.
Sector membership and ESG screens ran into the same difficulty. Many investors approached defence through broad inclusion or exclusion, treating it as a single block, when exposure in fact runs along a spectrum. Two companies in the same industry can earn very different proportions of their revenue from military customers, and companies in unrelated sectors can depend on the same budgets.
FactSet ESG Thematics measures that spectrum by attributing revenue across 141 Level 2 sub-themes. The chart below shows the entity population within the Aerospace, Defence and Arms category by sub-theme. Its breadth, spanning weapons systems, sensors, cybersecurity, satellite services and enabling technology under one label, shows why a sector-wide exclusion casts too wide a net, while three of the sub-themes carry the higher-sensitivity weapons exposure that draws mandate-level scrutiny.
ESG Thematics: Aerospace, Defence and Arms Entity Universe by L2 Thematic
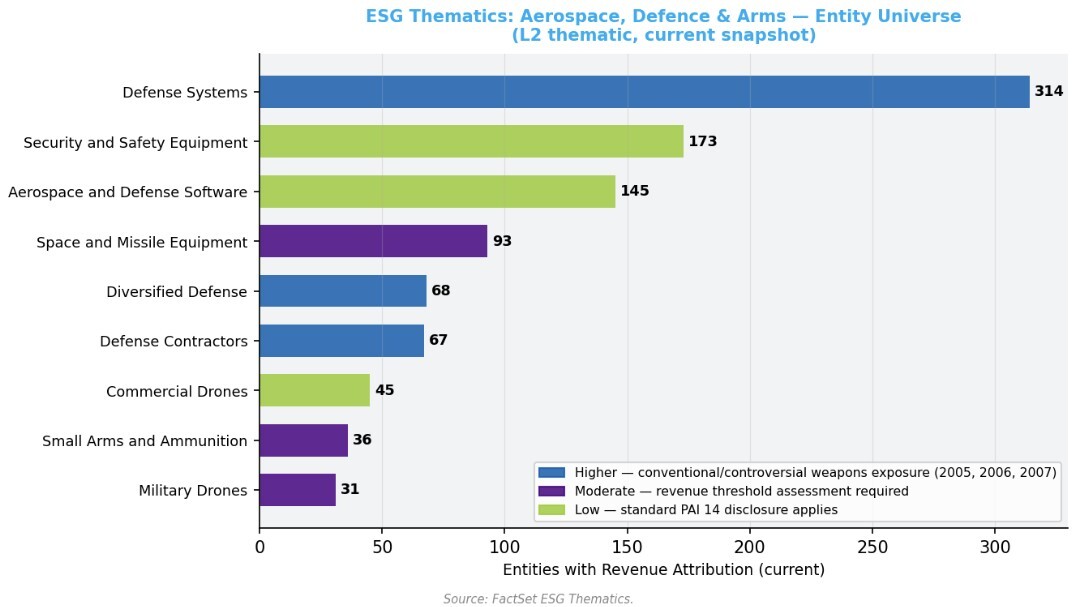
Figure 2 — ESG Thematics: Aerospace, Defence and Arms Entity Universe by L2 Thematic (as of 31 May 2026, live FactSet DB). Blue = higher exposure: Defence Contractors (L2 ID: 2005), Defence Systems (L2 ID: 2006), Diversified Defence (L2 ID: 2007). Amber = moderate / revenue-threshold assessed: Military Drones (L2 ID: 2008), Small Arms and Ammunition (L2 ID: 2010), Space and Missile Equipment (L2 ID: 2011). Green = lower exposure: Aerospace and Defence Software (L2 ID: 2003), Commercial Drones (L2 ID: 2004), Security and Safety Equipment (L2 ID: 2009). Source: FactSet ESG Thematics, as of 31 May 2026.
FactSet's Revere Business Industry Classification System (RBICS) is a comprehensive structured taxonomy designed to offer precise classification of global companies. The RBICS matrix structure is fourteen-by-six. At the lower levels, the patented bottom-up approach of classifying companies according to the products and services offers an unparalleled level of precision and granularity.
The top levels' market-defined approach, widely accepted by the investor community, is introduced to group companies based on their behaviour similarities and stock co-movement. RBICS Level 6 gives the most granular view, distinguishing sub-sectors within Aerospace and Defense Manufacturing that a broad label collapses together. The sub-sectors are listed below.
RBICS Level 6 Sub-Sectors Within Level 3 “Aerospace and Defense Manufacturing”
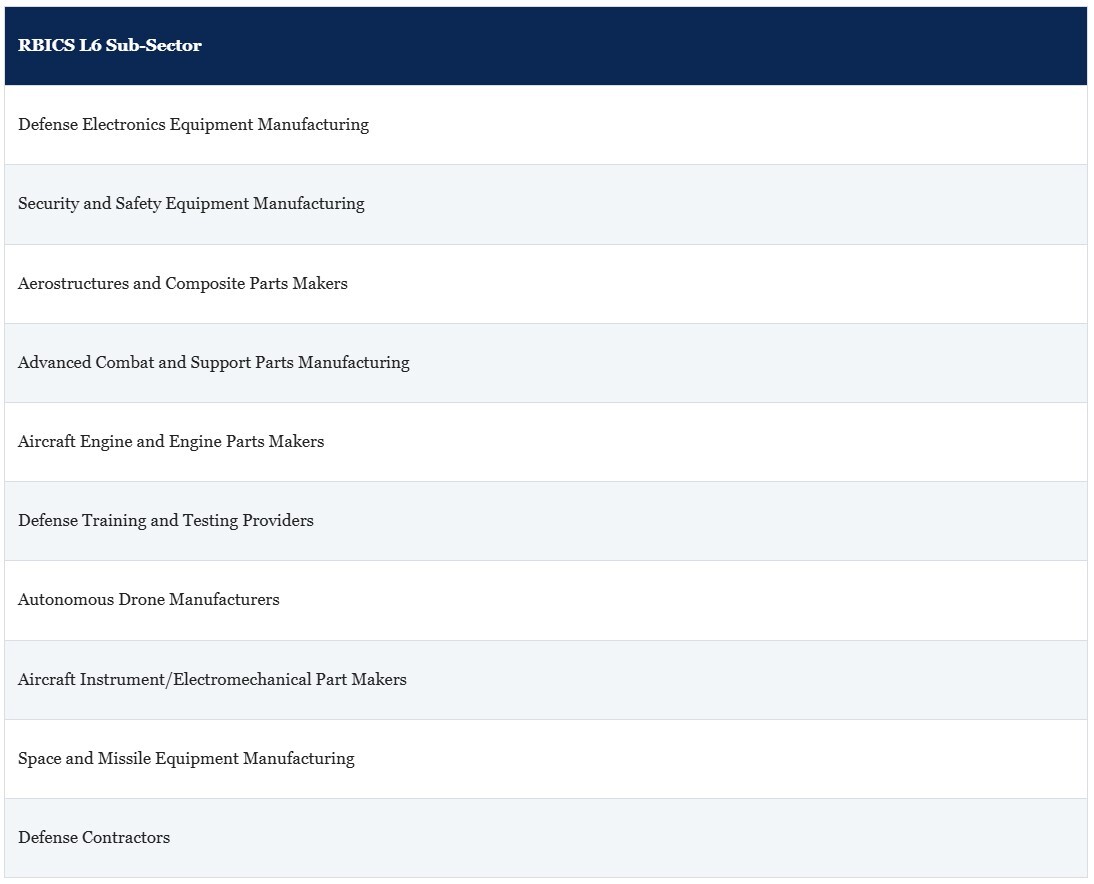
Source: FactSet RBICS, sub-sectors within Aerospace and Defense Manufacturing (Level 3).
At Level 3 (Aerospace and Defense Manufacturing), a nanosatellite manufacturer and a fuselage section supplier share a category. At Level 6 they do not. The sub-sector label separates them, and the customer mapping in Supply Chain Relationships confirms which procurement cycle each one actually serves.
The aerostructures names in Figure 1 illustrate the cost of missing that distinction. Latécoère (minus 90.5%), Montana Aerospace (minus 30.3%) and Velocity Composites (minus 36.5%) sit in the RBICS Aerostructures and Composite Parts sub-sector, and FactSet Supply Chain Relationships records their customers as Airbus (AIR-FR), Boeing, Safran, and Embraer: civil-aerospace programmes.
Because Airbus and Boeing also build military aircraft, these suppliers fall within the same RBICS Level 3 Aerospace and Defense Manufacturing category as the combat-systems names, yet their revenue is tied to the commercial-aviation cycle rather than to NATO procurement. Within RBICS Level 3 they are indistinguishable from a defence-electronics maker such as Bittium Oyj; at Level 6 the sub-sector label separates them.
The wider point is that themes are not sectors. Defence spending is an economic force that moves through supply chains, technologies and specialised capabilities, whereas conventional classifications were built to sort companies into industries, not to trace every path a procurement cycle takes to reach revenue. Following those paths calls for a different question: not how a company is classified, but what it sells, who buys it, and how much of its revenue depends on the theme. The rest of this article works through the data that answers it.
If conventional classification struggled to capture the full opportunity, the question is how exposure can be measured more directly. The answer begins with revenue. A company may carry an industrial, technology, or aerospace label and still earn a large share of its revenue from defence, and a company widely seen as a defence contractor may earn a good deal of its revenue from commercial markets that answer to entirely different drivers. For anyone trying to identify the beneficiaries of European rearmament, the variable that mattered was not the label attached to a company but the proportion of its revenue tied to defence procurement.
Knowing what a company does is not the same as knowing how much of its revenue depends on a theme. FactSet ESG Thematics adds that by attributing revenue across 141 sub-themes, turning a yes-or-no sector flag into a measured share. It attributes roughly 70% of revenue to the Aerospace, Defence and Arms theme for MS International, about 72% for Bittium and about 80% for OHB, and more than 90% for the primes Saab, BAE Systems, and Rheinmetall. Companies that look similar at the sector level can have very different revenue profiles once the share is measured.
OHB is a useful case. It is best known as a satellite and space business, and through a traditional sector lens it reads as a space-technology company rather than a defence contractor. Through the lens of end markets it is something else: a large part of its revenue comes from government, security and strategic space programmes, and ESG Thematics puts about 80% of it in the Aerospace, Defence and Arms theme, a figure a sector code does not surface. OHB returned about 1,211% over the period. At the end of January 2022 it was worth roughly EUR 632 million, with limited sell-side coverage and almost no listed peers, the kind of setting in which a change in revenue can run for a while before the wider market reflects it.
ESG Thematics does not rely on revenue figures alone, and Exail Technologies shows why that helps. The company makes inertial navigation systems, fibre-optic gyroscopes, and autonomous underwater vehicles for naval and commercial marine customers. Its disclosed revenue is not yet broken out in a way that surfaces a defence share, so a revenue figure on its own would understate the involvement.
FactSet’s product and tradename mapping picks it up, associating Exail’s product lines with the Military Drones and Defence Electronics sub-themes. For companies newer to the theme, or that do not yet report defence revenue separately, that product and tradename mapping captures exposure the revenue split alone would not yet show.
Bittium makes the same point in defence electronics, where RBICS places it and ESG Thematics attributes about 72% of its revenue to defence. None of these companies fits the traditional image of a defence prime, and all of them depended on the same spending. What connected them was not a shared sector label but exposure to the same source of demand.
The full picture of how returns were distributed across the beyond-prime universe is set out in the table below.
European Defence Companies Beyond the Primes: Full-Period and One-Year Returns
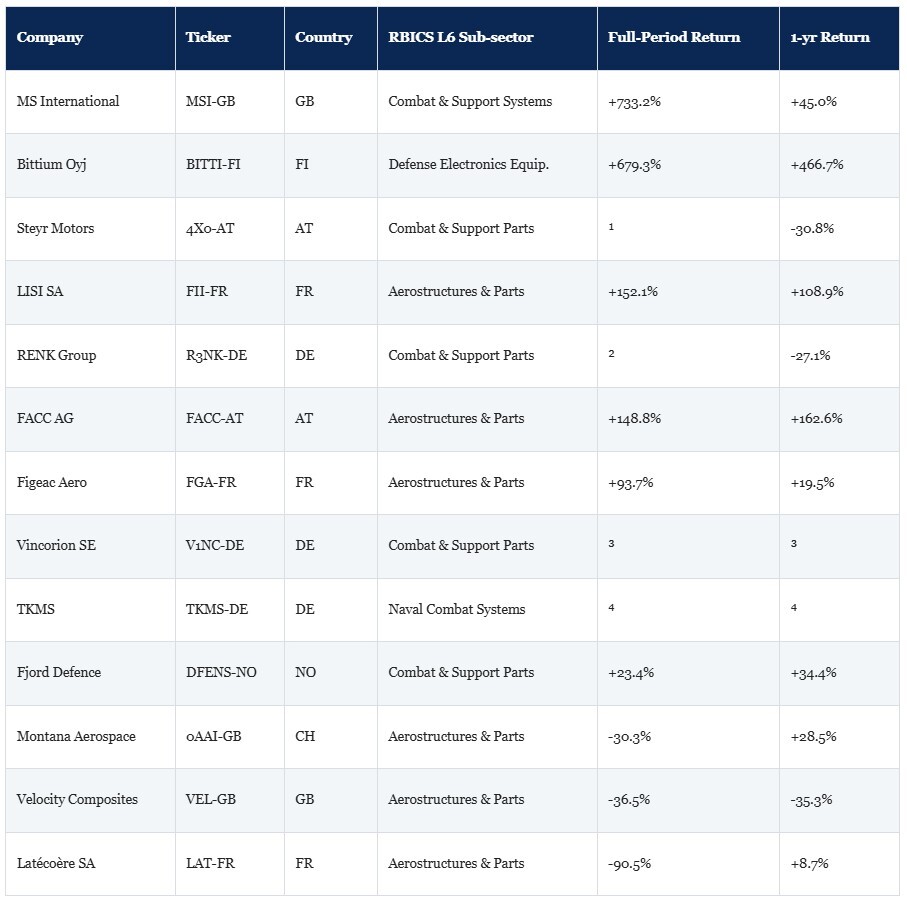
Source: FactSet Prices (total returns, local currency, dividends reinvested). Full period: 3 Jan 2022–31 May 2026 (approx. 4 1/3 years). 1-year: 31 May 2025–31 May 2026. None of these companies appear in the NYSE FactSet Global Aerospace and Defense Technology Index or NYSE FactSet Europe Defense Top 10 Index constituents as of December 2025. ¹ Steyr Motors AG (entity 10P0Z5-E, ISIN AT0000A3FW25, fsym_id QDTMY3-R): Frankfurt Scale listing Oct 2024, Vienna Feb 2025; 3-year return not available; 1-year return (May 2025–May 2026, FactSet Prices): −30.8%; return since IPO to May 2026: +144.8%. ² RENK Group AG (entity 0VSYC0-E, ISIN DE000RENK730, fsym_id J4DR4W-R): public listing XETRA Feb 2024; 3-year return not available (IPO post-dates Jan 2022 start); 1-year return (May 2025–May 2026, FactSet Prices): −27.1%; return since IPO to May 2026: +194.2%. ³ Vincorion SE (entity 137T6J-E, ISIN DE000VNC0014, fsym_id HFN2X6-R): Frankfurt listing Mar 2026; neither 3-year nor 1-year return available; return since IPO to May 2026 (FactSet): +1.6%. ⁴ TKMS AG & Co. KGaA (entity 12TPND-E, ISIN DE000TKMS001, fsym_id WMJQC3-R): XETRA listing Oct 2025; neither 3-year nor 1-year return available; return since IPO to May 2026 (FactSet): +1.8%. All returns FactSet Prices, local currency, dividends reinvested. Past performance is not indicative of future results.
Naval programmes run on a slower clock, which is why a pure-play naval prime can lag the faster-moving suppliers. The German-Norwegian Type 212CD submarine programme shows the pattern: TKMS was awarded the EUR 5.5 billion contract in 2021, began production in 2023, and is not scheduled to deliver the first boat until 2029. For a naval prime, a budget commitment converts into revenue over many years, far more slowly than for the electronics and component suppliers that repriced first.
What matters, then, is not whether a company belongs to the defence sector but how much of its business depends on the cycle driving the theme.
What a company sells is one dimension of exposure. Where its revenue comes from is another, and after 2022 that geographic dimension carried unusual weight, because European spending did not rise evenly. A company can earn a meaningful share of its revenue from defence and still depend on budgets outside Europe.
Germany established its EUR 100 billion fund, Poland pushed defence spending above 4% of GDP, Sweden joined NATO in March 2024, and the Baltic states grew their budgets quickly from a smaller base. Two companies making similar products could therefore have very different fortunes, depending on whether their customers sat inside or outside those budgets.
Country of domicile can sit a long way from where the revenue is earned, and a global defence index shows how far the two can diverge. In the NYSE FactSet Global Aerospace and Defense Technology Index, country of listing puts Japan at 24.6%, South Korea at 20.3%, Taiwan at 8.7% and the United States at 35.6%. FactSet GeoRev, applied across the constituents by where revenue is actually earned, changes the picture: US exposure stays close, at 36.5%, while Japan falls to 15.5%, South Korea to 9.1%, Taiwan to 2.6%, and a 6.6% exposure to China appears that the listing view does not show at all.
TSMC is the clearest single example. Listed in Taiwan, it earns about 74.4% of its revenue in the United States, and it is the index’s largest constituent at roughly 6.37%. By listing it looks Taiwanese; by revenue it is largely US-facing. For a defence-themed index, that distinction decides what the position is actually exposed to.
NYSE FactSet Global Aerospace and Defense Technology Index: Top 10 Constituents
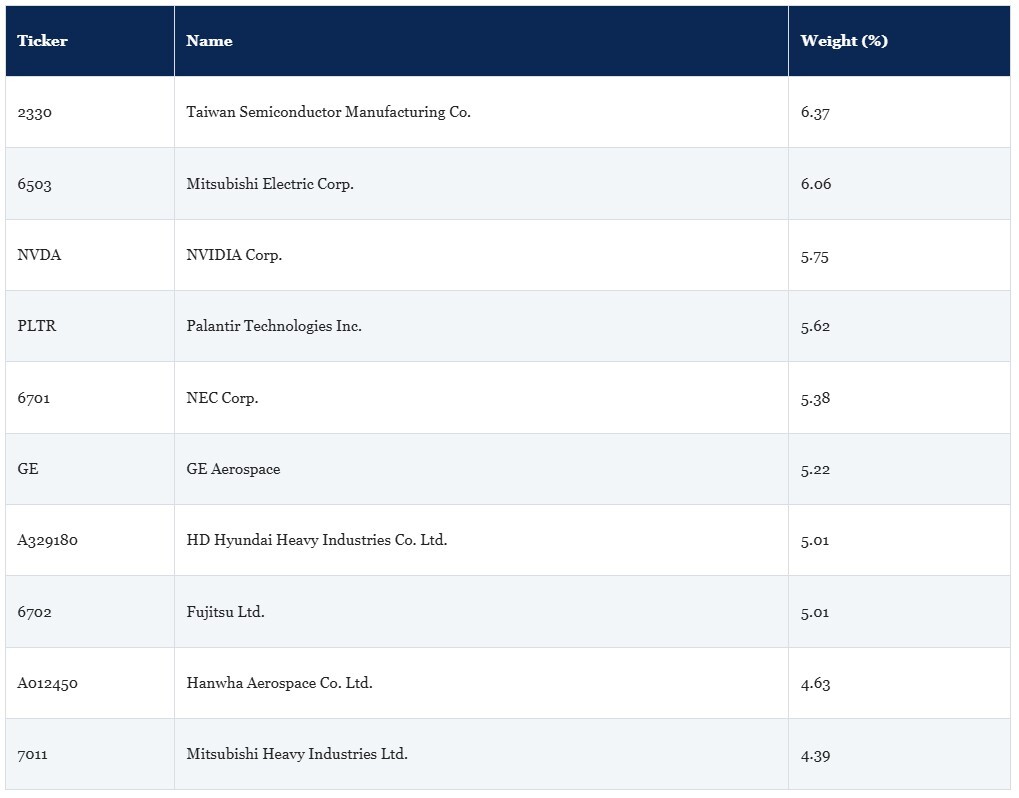
Source: NYSE FactSet Global Aerospace and Defense Technology Index factsheet, 31 December 2025.
This is not a flaw in index construction. It reflects how global companies operate, but it has direct consequences for reading geographic exposure, and it explains part of the performance difference between global and European-focused defence benchmarks.
The NYSE FactSet Europe Defense Top 10 Index, which requires at least 20% of revenue from defence manufacturing, delivered a backtested one-year return of +81.93% and a three-year annualised return of +58.77% in euros to December 2025, against +68.99% and +46.20% in US dollars for the global index. These European figures are backtested and simulated rather than a live record, as the index went live in July 2025.
NYSE FactSet Index Comparison
Insight/f-table.jpg?width=908&height=885&name=f-table.jpg)
Source: ICE Data Indices / NYSE FactSet Index factsheets, as of 31 December 2025. Methodology for both indices courtesy of Jeremy Zhou, FactSet Indexing Solutions. ETF data: FactSet ETF data. Past performance is not indicative of future results. ¹ Backtested / simulated — not a live track record. The NYSE FactSet Europe Defense Top 10 Index went live in July 2025; returns prior to that date are simulated performance of the methodology applied to historical data. Simulated past performance is not a reliable indicator of future results and does not represent actual returns achievable by investors.
The current constituents of the NYSE FactSet Europe Defense Top 10 Index make that alignment concrete.
NYSE FactSet Europe Defense Top 10 Index: Constituents
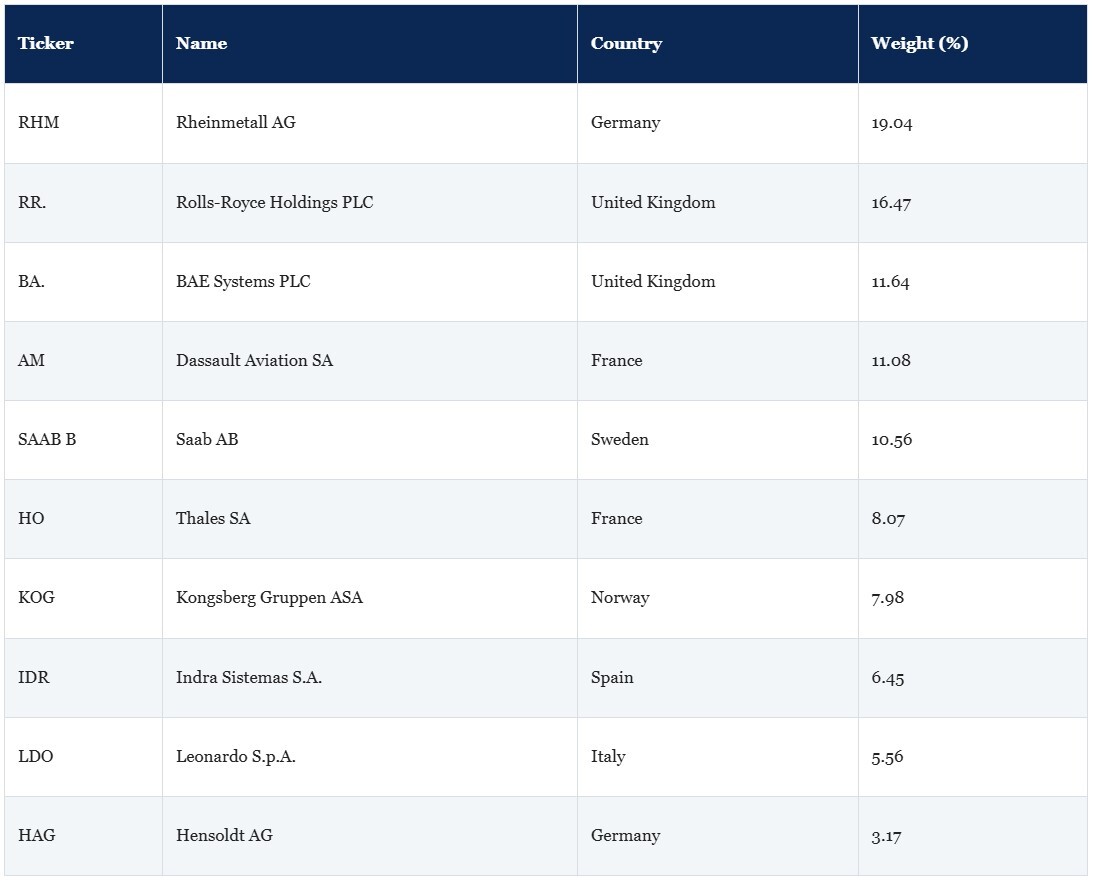
Source: NYSE FactSet Europe Defense Top 10 Index factsheet, 31 December 2025. Tickers shown as they appear on the index factsheet (local-exchange convention, e.g. BA. and RR. for the London listings); the FactSet-format equivalents (BA-GB, RR-GB) appear in the Appendix security reference table. Country weights: UK 28.1%, Germany 22.2%, France 19.1%, Sweden 10.6%, Norway 8.0%, Spain 6.4%, Italy 5.6%. Currency exposure: EUR 53.4%, GBP 28.1%, SEK 10.6%, NOK 8.0%.
FactSet Geographic Revenue makes this measurable rather than inferred. It provides annual country-level revenue for the companies it covers, going back well before the current cycle, so a company’s exposure to Germany, Poland, France, and the other procurement markets can be tracked year by year and set against its returns. That is the difference between knowing where a company is listed and knowing where its business actually is.
Revenue attribution shows who takes part in a spending cycle, and geography shows where the demand sits. Neither fully explains why some companies reprice earlier than others. That comes down to the structure of the industry. Government money rarely moves straight from a defence ministry to every listed company exposed to the theme. It passes through prime contractors, then subsystem makers, then component suppliers, and the distance between a budget announcement and a visible change in revenue depends on where a company sits in that chain.
The primes were recognised first. Companies such as Saab, Rheinmetall, BAE Systems, Leonardo, and Thales hold direct government relationships, win the headline contracts and are closely followed by research desks, so the link between rising budgets and improving revenue was understood and priced quickly. What the four-year record shows most clearly is the sequencing: BAE Systems, Leonardo, Thales, Safran, Airbus and Dassault Aviation rerated first, and investors holding them before 2022 captured much of that move.
Figure 3 shows the total return of selected European prime defence contractors rebased to 100 at 3 January 2022. Rheinmetall, BAE Systems, Rolls-Royce, and Dassault Aviation are absent from Figure 3 because they are the widely followed primes, already well covered by mainstream equity research. Figure 3 concentrates on the less visible names, which is where the thesis about classification gaps and delayed repricing is most directly testable. All of the larger names appear in the index constituent tables in Section 5 and in the appendix.
European Prime Defence Contractors — Total Return (rebased to 100)
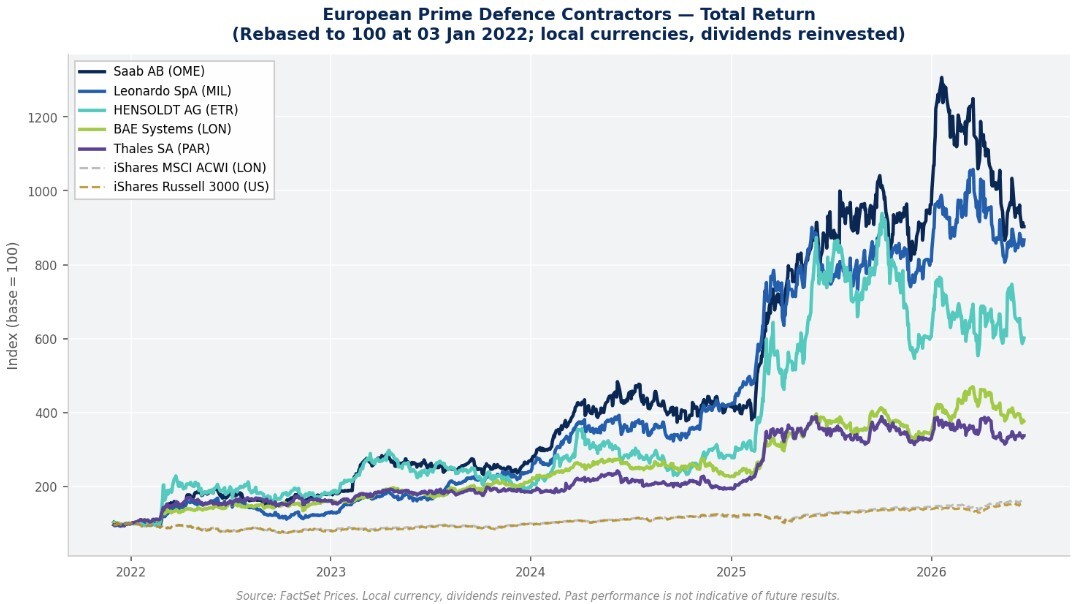
Figure 3 — European Prime Defence Contractors: Total Return vs Benchmark (3 January 2022 = 100). Source: FactSet Prices. Local currency, dividends reinvested. From 3 January 2022. Past performance is not indicative of future results.
Further down the chain the signal was slower to arrive. Many specialist suppliers sell not to governments but to the primes, so their exposure is indirect. A new missile, radar, or naval programme might eventually pull through orders for their sensors, navigation or communications equipment, but the connection sat several steps from the original announcement, and the market recognised it later.
Figure 4 makes this sequencing concrete. It rebases selected mid-cap names to 100 at the start of January 2023 and plots them against the MSCI ACWI. By the close of the period the mid-cap lines sit well above the benchmark, but the trajectory differs from that of the primes: the move is later, steeper in the most recent periods and still running in several cases.
Defence Ecosystem: Mid-Caps and ETFs vs MSCI ACWI Benchmark
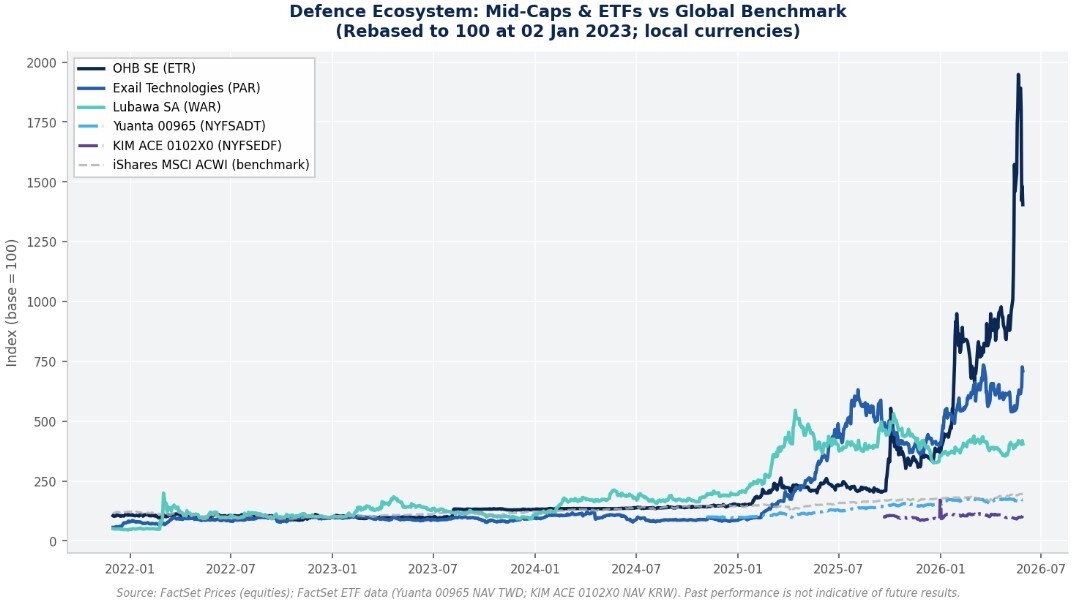
Figure 4 — Defence Ecosystem: Mid-Caps and NYSE FactSet Index ETFs vs MSCI ACWI Benchmark. Source: FactSet Prices (equities); FactSet ETF data (NAV total return, local currency). Yuanta 00965 tracks the NYSE FactSet Global Aerospace and Defense Technology Index (TWD); KIM ACE 0102X0 tracks the NYSE FactSet Europe Defense Top 10 Index (KRW). Past performance is not indicative of future results.
That lag is still visible at the end of the period. As of May 2026, the trailing twelve-month ranking is led by mid-cap ecosystem names rather than the primes that drove the first phase: OHB returned about 490% over the year and Bittium about 467%, and no prime contractor leads that ranking. The supply chain has not converged with the prime-contractor rerating. It is still moving, in some cases faster than the primes did.
Total Return Comparison: All Securities, Full Period and One Year
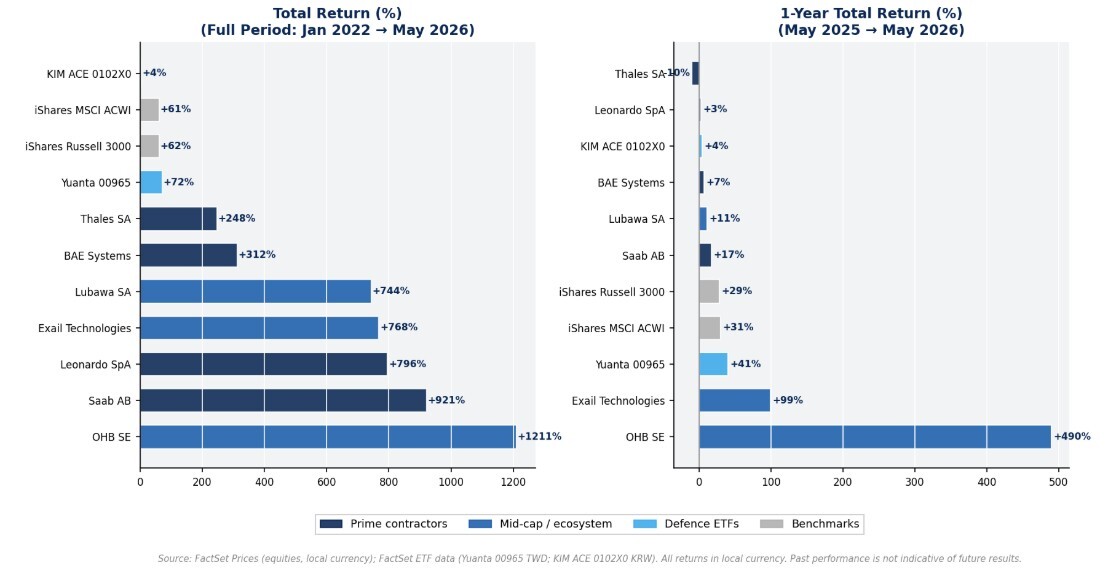
Figure 5 — Total Return Comparison: All Securities, Full Period (Jan 2022–May 2026) and 1-Year (as of May 2026). Source: FactSet Prices and FactSet ETF data. Local currency, total return with dividends reinvested. Past performance is not indicative of future results.
Part of the reason is structural. The mid-caps started smaller and less followed, so a change in their revenue could run for a while before it drew enough research for large allocators to act on, and their indirect position in the chain stretched the gap between a budget commitment and a reported order.
FactSet Supply Chain Relationships helps trace that position. It records supplier, customer and partner links between companies, drawing on disclosures from both the company and its counterparties, and now covers more than 900,000 relationships across close to 50,000 companies. Those links can be followed beyond a company’s immediate suppliers and customers to the tiers behind them.
For the names in this article, that resolves to specific, checkable connections. OHB’s recorded customers include the European Space Agency and EUMETSAT, Europe’s meteorological-satellite organisation. Bittium supplies the Finnish and Swedish governments, and its relationships also include the North Atlantic Treaty Organisation. RENK’s recorded customers include the US Army and Kongsberg. Those links separate companies whose defence exposure is central from those whose defence revenue is incidental, and they point to where in the chain, and through which buyer, the exposure runs.
The table below sets out the most active research-collaboration themes recorded in FactSet Supply Chain Relationships across the European defence companies discussed in this article. The partners listed against each theme are a reasonable starting point for identifying companies exposed to the next phase of the cycle.
Active Research-Collaboration Themes: European Defence
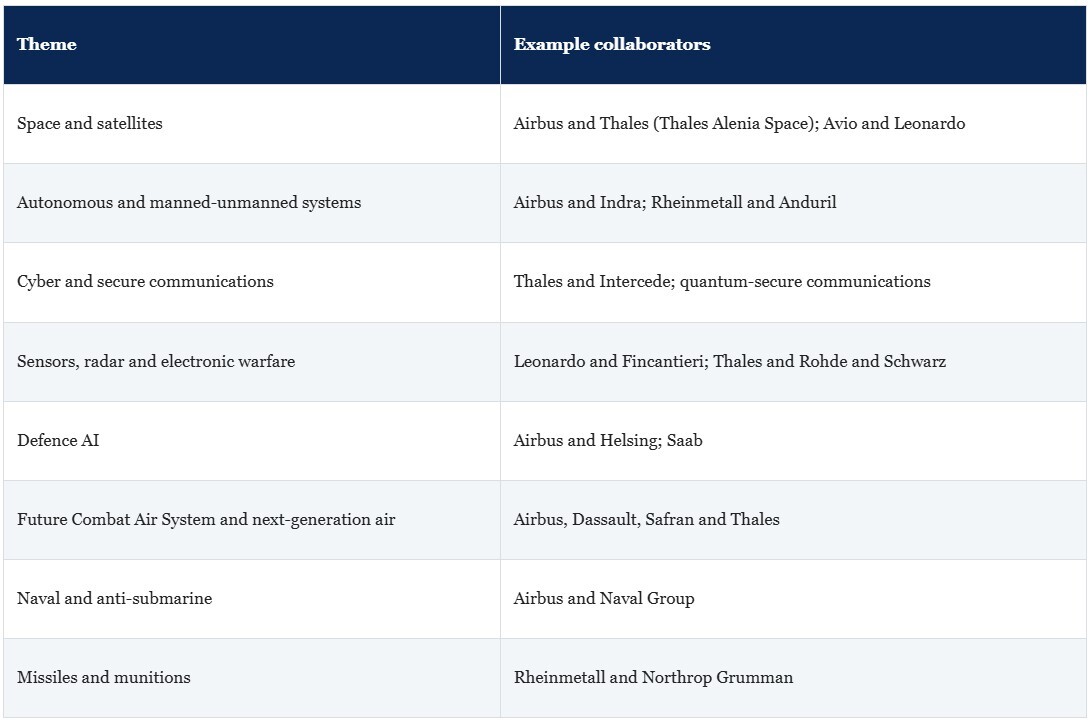
Active research-collaboration themes recorded in FactSet Supply Chain Relationships across the European defence companies discussed in this article (illustrative, not exhaustive). A single relationship can fall under more than one theme. Source: FactSet Supply Chain Relationships, research-collaboration relationships as of 31 May 2026 and analyst-collected keywords.
This is a screening input, not a recommendation. It does not identify any company as mispriced, and it does not assume these relationships will translate into returns. It points to candidates worth examining, drawn from the data used throughout this article.
Smaller companies produced some of the largest returns. MS International returned more than 700% over the period. It is clearly a defence business, with about 70% of revenue in the Aerospace, Defence and Arms theme and an RBICS Level 6 placement in missile, naval and ground combat systems, but it is small enough to fall outside the main defence benchmarks, which is part of why its move drew less attention than the primes.
Position in the chain is not, on its own, a reason to expect higher returns, and many of these names underperformed over the period. What the relationship data adds is the disclosed links between a company and the prime contractors or government buyers it supplies. Combined with revenue attribution and geographic exposure, these links give a more rounded view of where a company sits in the cycle.
One area where this granular view matters is ESG compliance. SFDR does not require a sector-level exclusion of defence. It works through activity-based exclusions and issuer-level disclosure, and the European Commission’s 2025 review proposal (COM/2025/841) acknowledged that Articles 8 and 9 had been used as quasi-labels. In practice, many institutional policies went beyond the regulatory minimum and applied broad defence exclusions, which catch sensor makers, satellite integrators, and navigation specialists alongside weapons manufacturers.
A measured approach is more discriminating. FactSet ESG Thematics quantifies which sub-themes generate an issuer’s revenue and at what share, and RBICS at Level 6 identifies which sub-sectors carry it, which together turn the question of whether something is a defence company into the narrower one of which activities generate the revenue, in which sub-sectors, and at what threshold. Norway’s Government Pension Fund Global already screens at that level of detail, with a public exclusion register driven by specific weapons-system criteria under which some defence companies appear and others in the same sector do not. (The discussion of SFDR and ESG frameworks here is informational and not legal or regulatory advice.)
Between January 2022 and May 2026, the defence rerating rewarded companies unevenly. Within the same broad classification, some names multiplied several times over while others lost most of their value, and the difference tracked things the sector label did not capture: what a company actually made, how much of its revenue came from defence, where that revenue was earned, and whom it supplied. These are the characteristics that RBICS, ESG Thematics, GeoRev, and Supply Chain Relationships capture.
What shifts in 2026 is the emphasis. In 2022 much of the work was identifying which companies had real, measurable exposure to a procurement cycle the market had not yet fully priced. As that initial rerating matures, the emphasis moves toward whether the underlying revenue data still support the positions that current prices imply.
That said, the path ahead is not assured. Budgets have been announced faster than they have converted into signed contracts, and history shows defence spending can recede as well as build. The pattern is not unique to defence either: Wherever a theme cuts across sector lines, a granular, revenue-anchored view tends to show what a single label cannot.
Appendix: FactSet Security Reference
All securities referenced in this article are identified below by FactSet ticker, FactSet Entity ID, ISIN, regional fsym_id (R-suffix, used in FactSet Prices), and primary listing exchange. ETF NAV series are identified by S-suffix fsym_ids in FactSet ETF data (DFNS TQSS2X-S, NATO HXD8L0-S, WDEF GX8L02-S, ARMY GN5J9L-S, Yuanta 00965 G5G4CS-S, KIM ACE 0102X0 VNHNG9-S). The two underlying NYSE FactSet indices are identified by their index codes, NYFSADT (Global Aerospace and Defense Technology), and NYFSEDF (Europe Defense Top 10); these are index families rather than separately listed securities, and their investable fsym references are the tracker ETFs above (Yuanta 00965 for NYFSADT, KIM ACE 0102X0 for NYFSEDF).
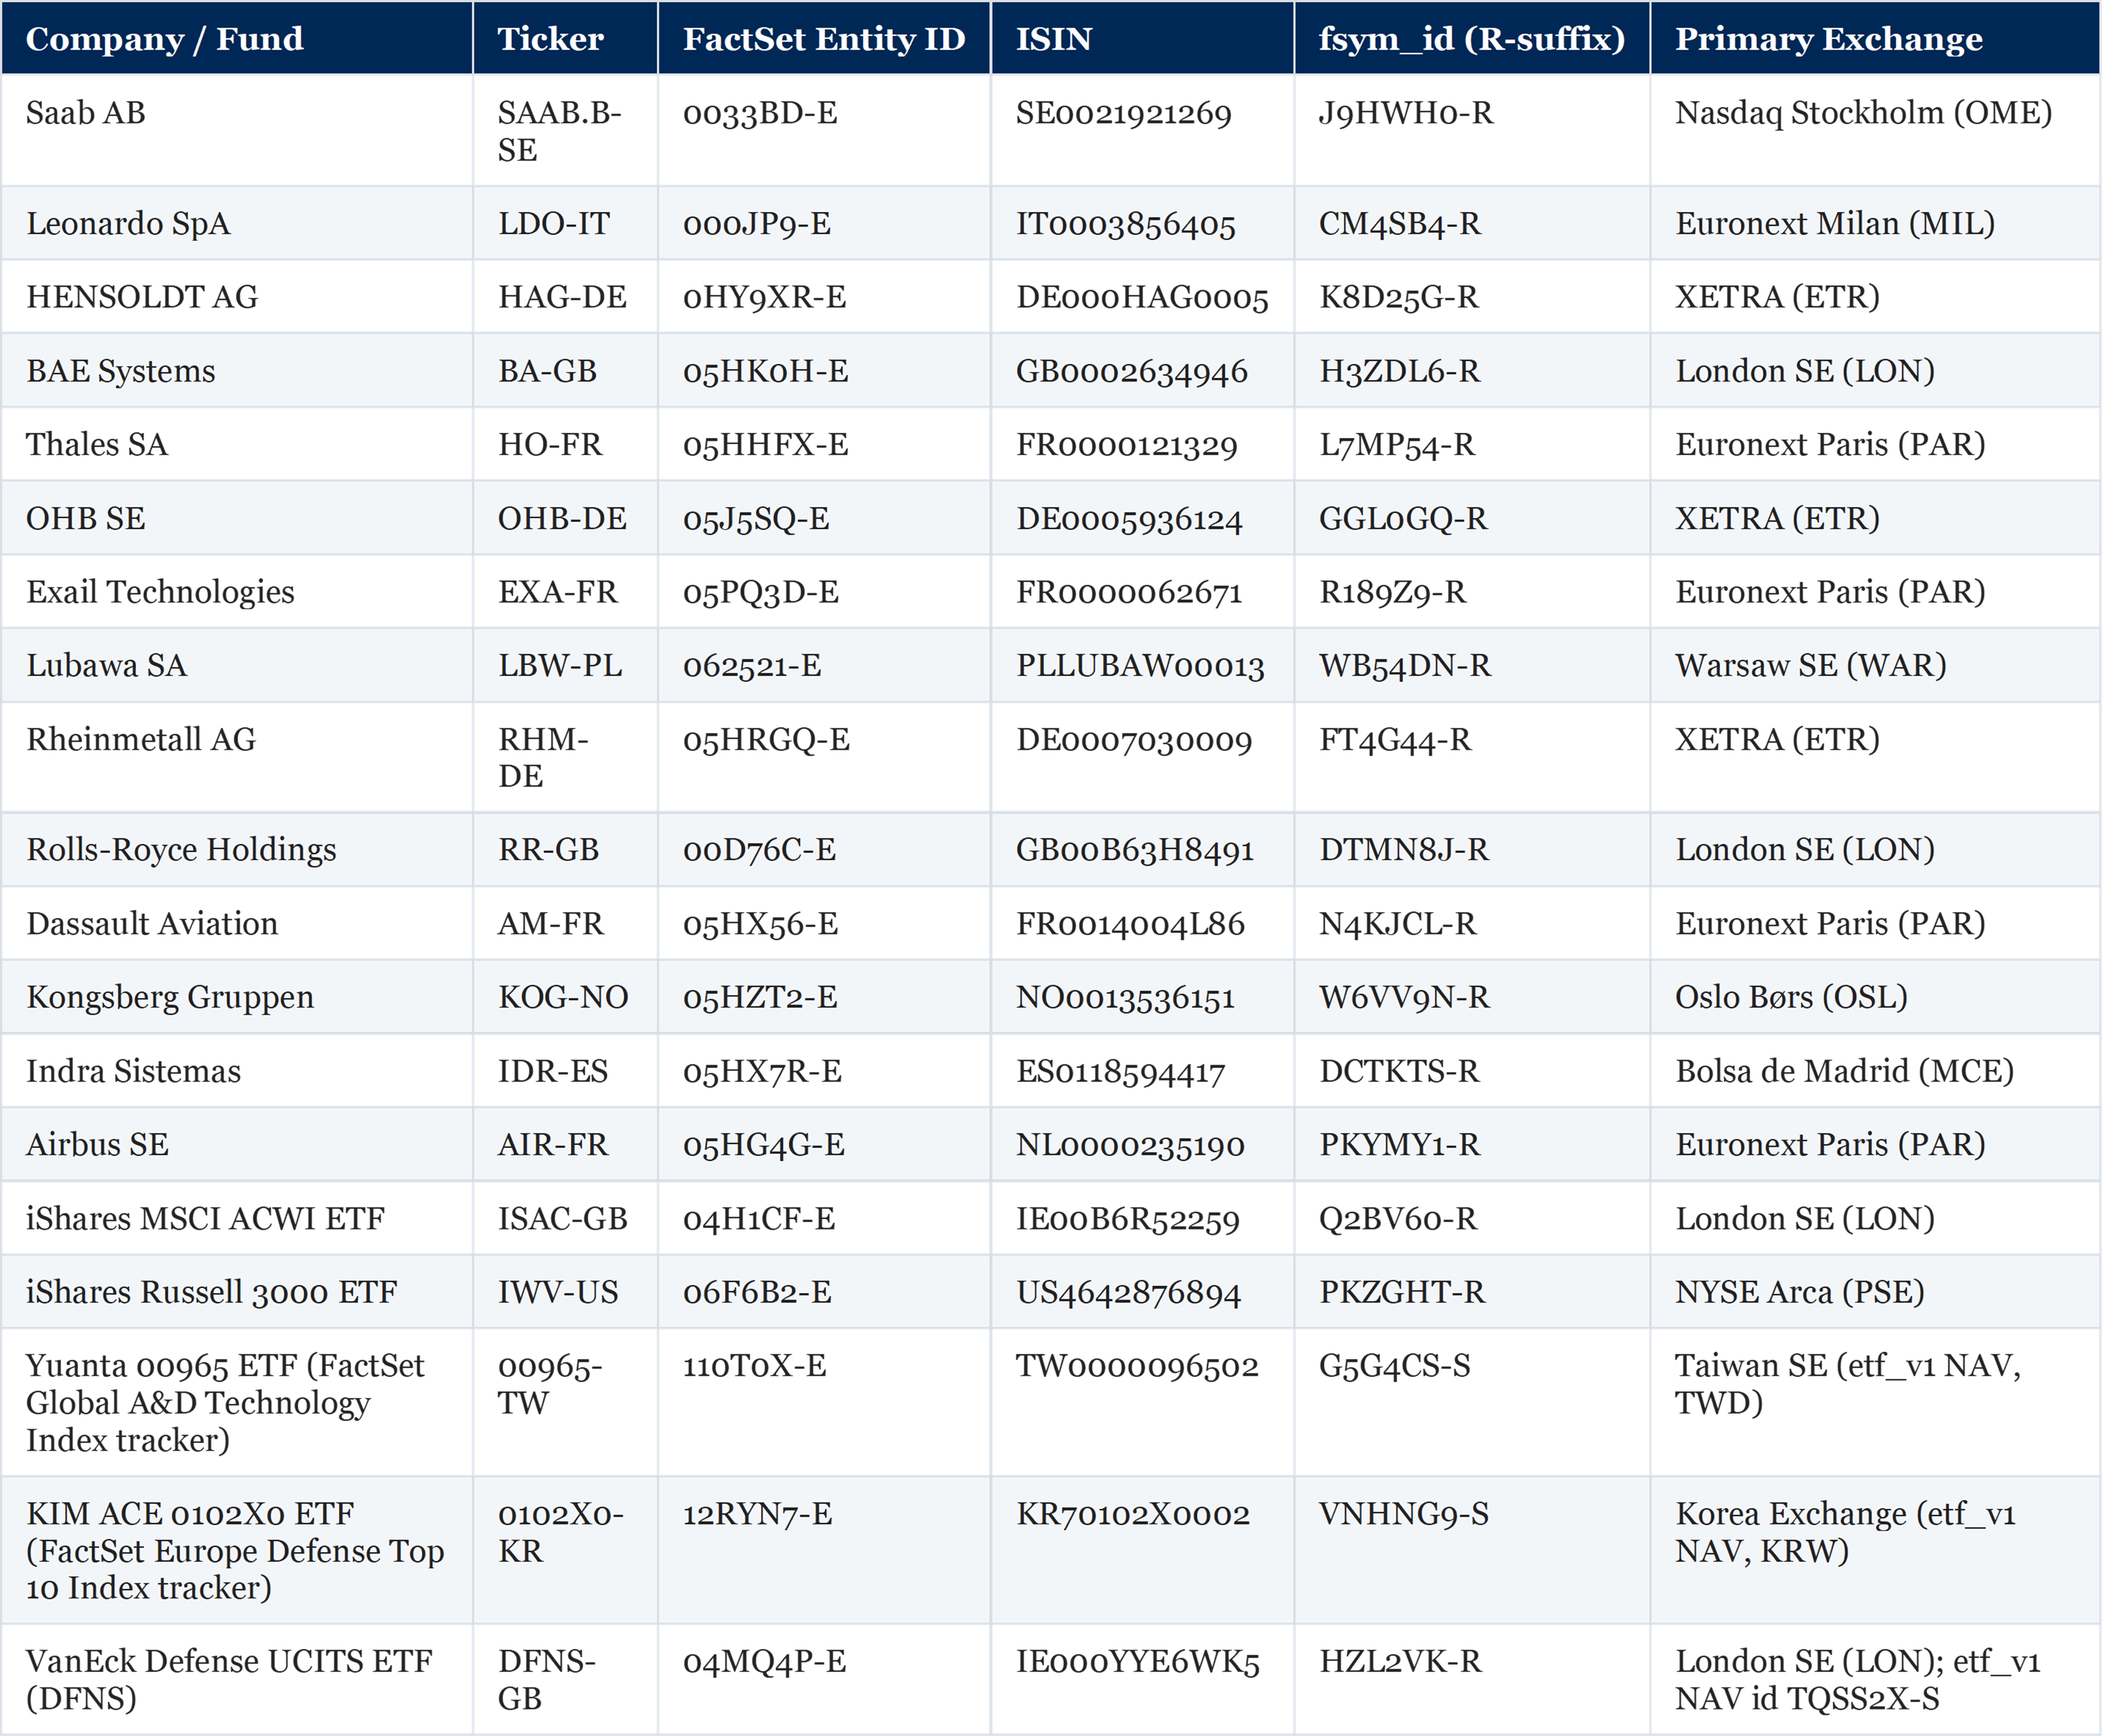
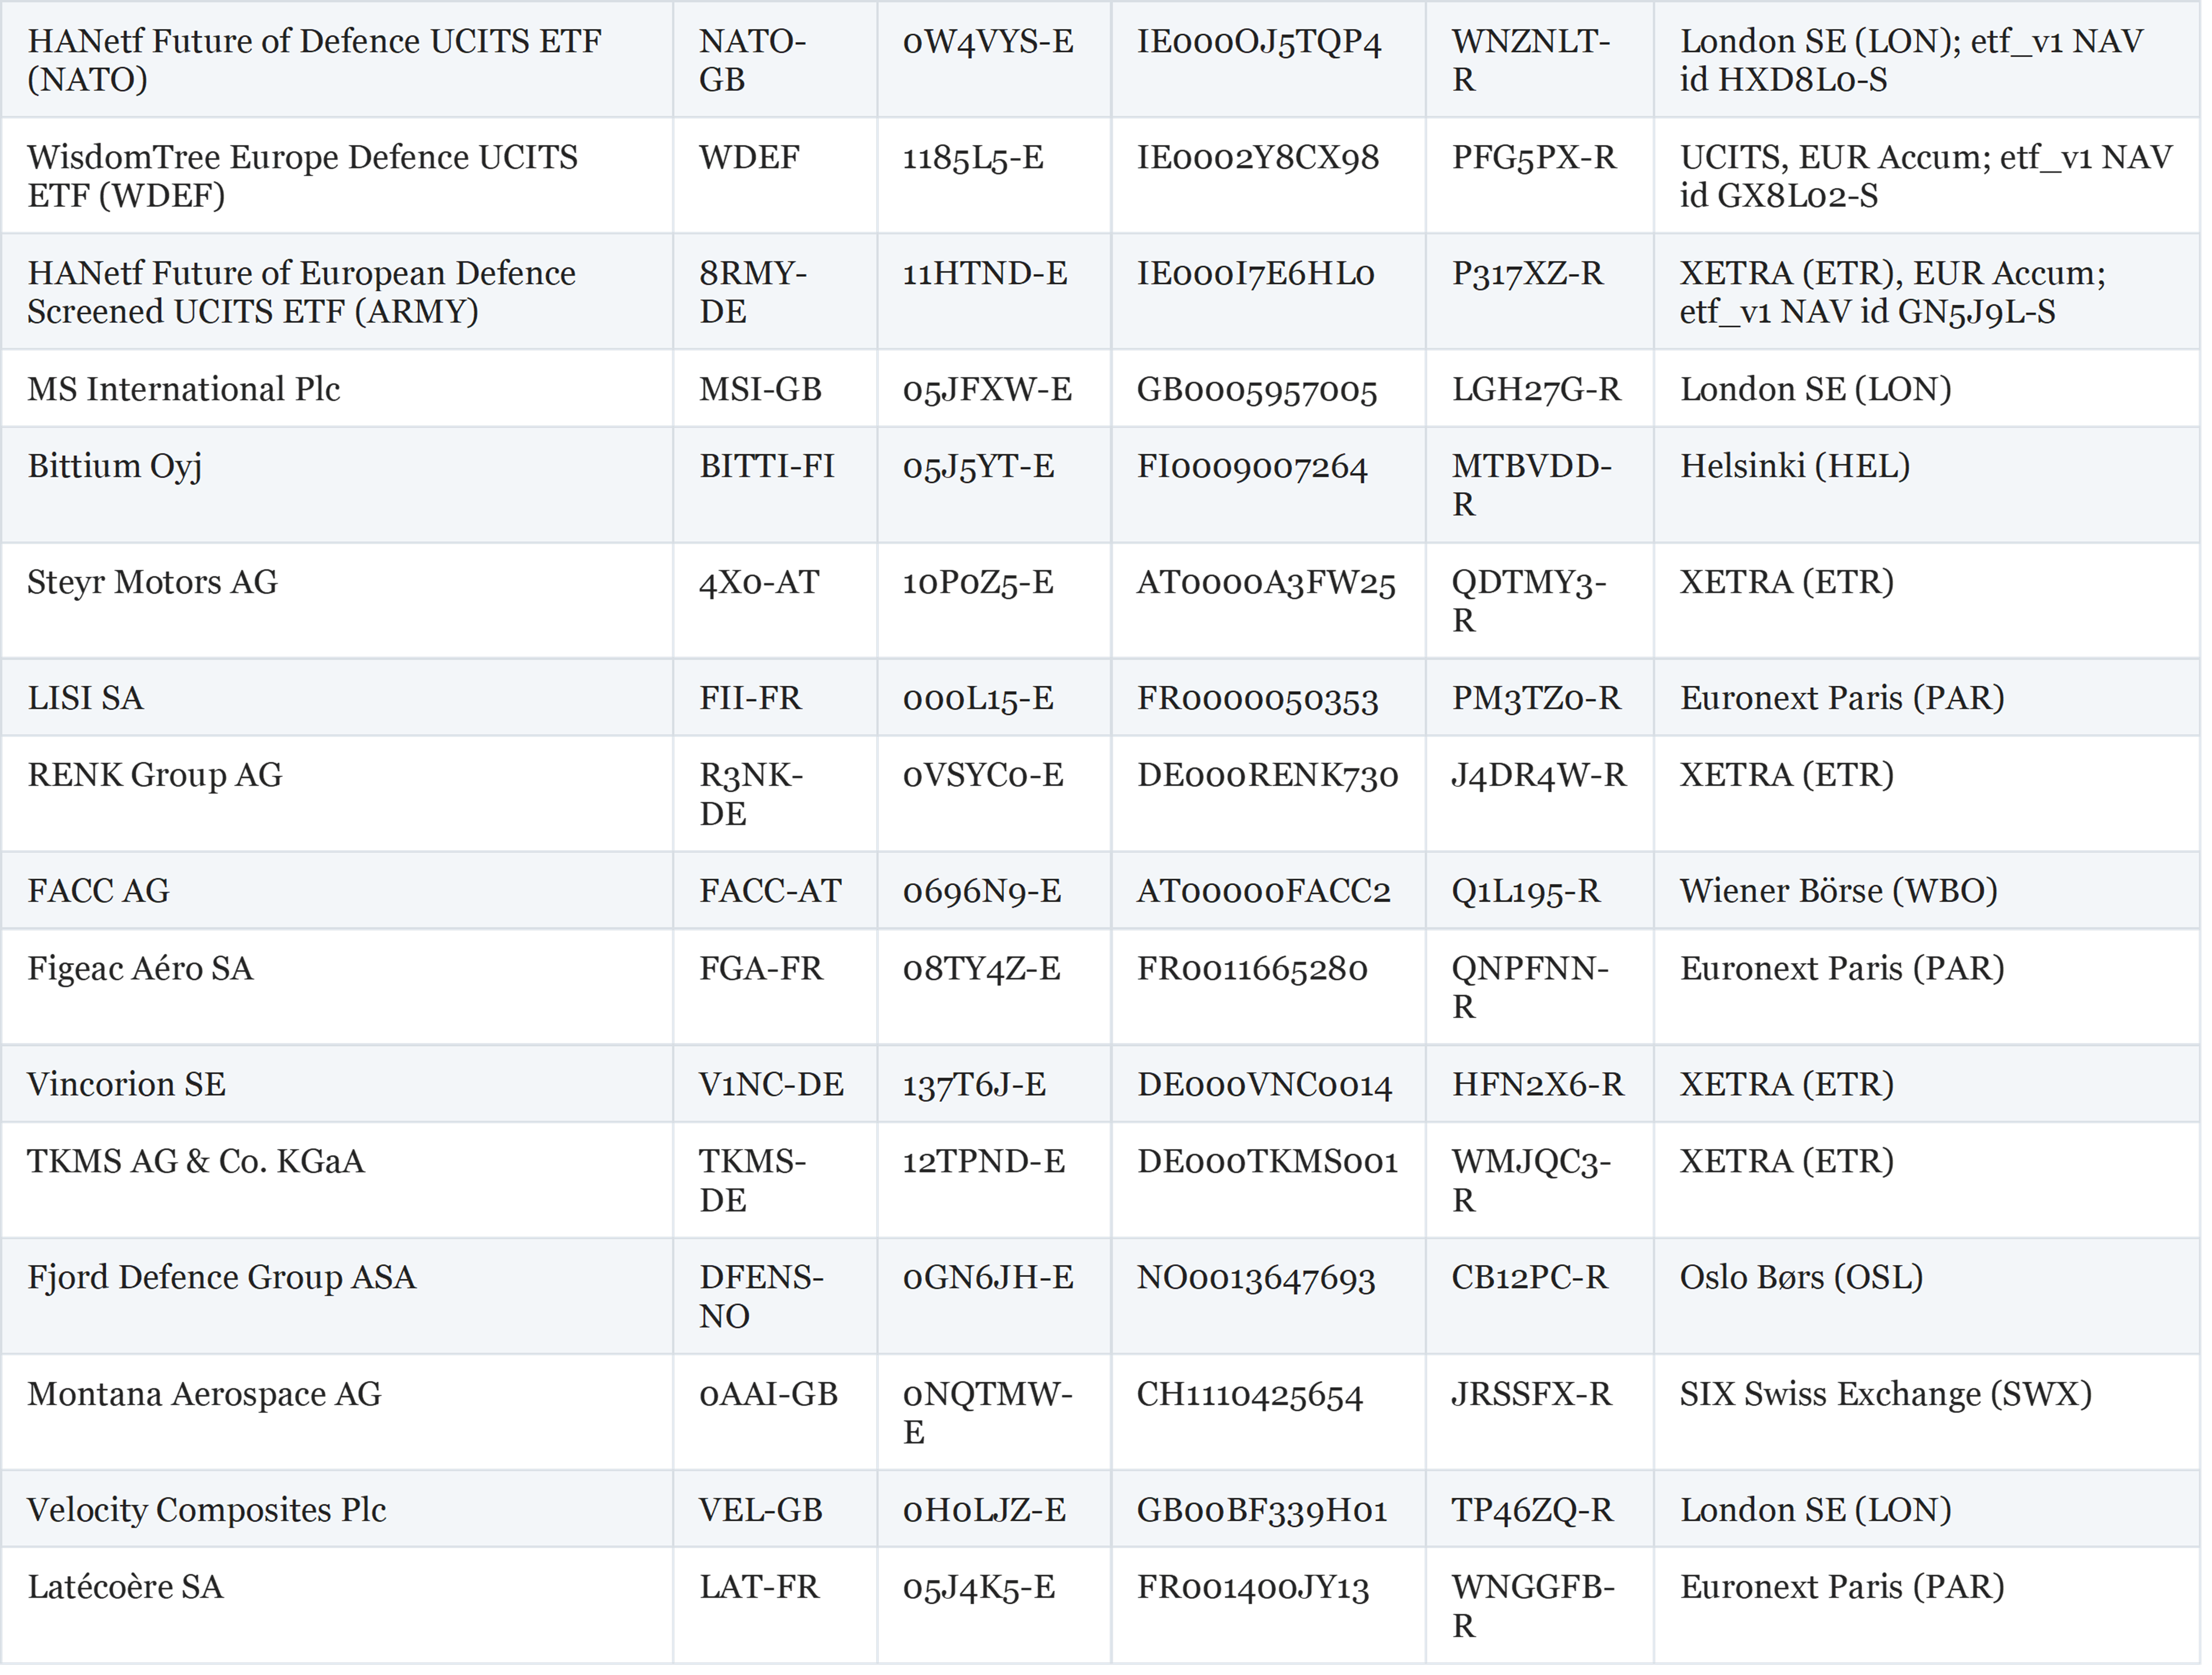
Source: FactSet Symbology and FactSet ETF data. Entity IDs and ISINs verified via live queries against the FactSet Standard DataFeed (May 2026). R-suffix fsym_ids are regional listing identifiers used in FactSet Prices. ETF rows use S-suffix IDs for FactSet ETF data NAV series. Saab AB ISIN SE0021921269: Series B shares (more liquid; post 4:1 split May 2024).
This article is published by FactSet and references FactSet proprietary datasets and index products. It is provided for informational purposes only and does not constitute investment advice, a recommendation, or legal or regulatory advice. Past performance is not indicative of future results.
This blog post is for informational purposes only. The information contained in this blog post is not legal, tax, or investment advice. FactSet does not endorse or recommend any investments and assumes no liability for any consequence relating directly or indirectly to any action or inaction taken based on the information contained in this article.

Insight/Author%20Bios/Anna%20Shapoval.jpeg)
Ms. Anna Shapoval is a Senior Product Manager at FactSet. In this role, she focuses on driving business growth and the development of the Revere product suite. Ms. Shapoval joined FactSet in 2016. Prior to FactSet, she worked 10+ years in various finance functions including product management, consultative sales, audit, and HR at companies like Bloomberg and PwC. Ms. Shapoval earned a Master's in International Trade from the University of Bath and Humboldt University of Berlin.

Finding the Limit: Examining the Risk-to-Return Ratio in Private Market Performances
Explore how geography impacts risk and return across investment styles in private markets in this monthly FactSet analysis.
Timing Signal Composites with Macro Regime Predictions
Explore this FactSet analysis, which extends a previous study of weighting signals by introducing a forward-looking macro regime...
U.S. Mergers & Acquisitions Monthly Review: August 2026
Explore FactSet's U.S. Mergers & Acquisitions Monthly Review. Gain deep insights into market trends and expert analysis to inform...
Disclosure Issue Leads to Unwind and Attracts Additional Attention to the Insurance Industry
Stay ahead with FactSet’s weekly insights on the latest insurance industry updates, trends, events, and market developments.
The information contained in this article is not investment advice. FactSet does not endorse or recommend any investments and assumes no liability for any consequence relating directly or indirectly to any action or inaction taken based on the information contained in this article.

 Post Comment