

China, the second largest economy in the world, has recently witnessed major volatility in its domestic stock market, reflecting a period of transition. Investors both in Asia and abroad fear negative impact on their investments as China's economy slows.
To what extent is the recent China slowdown impacting the rest of Asia? And, more importantly, do you understand your true exposure to this slowdown?
Let's first examine the state and future of China's economy. If we compare China to the G7, we see that (as of September 2015), China's unemployment rate of 4.0% is actually very good relative to the rest of the G7 and is, in fact, lower than the U.S. rate of 5.4%. We also see that China's unemployment is three times better than that of Italy, which currently has the worst employment situation of the group.

Different reporting standards across countries can present challenges to working with economic data. For example, the United States reports its Real GDP in USD, whereas Italy reports in euros. Items may also be reported in different base years, making direct country‐to‐country comparisons difficult. For this example, I used FactSet's Standardized Economic Data, which solves these problems by creating a set of 42 commonly‐used economic items that are standardized and comparable across 90 countries.
Actual data is valuable but gaining insight into what is expected to happen and what the trend is likely to be is critical. Economic Estimates gives us a look into the direction these key measures are likely to take over the coming quarters and years. And whilst the actual data still placed China in a relatively good position in September 2015, our Estimates data indicates that the China slowdown is likely to last and actually get worse over time, with GDP growth forecast to drop to 6.5% and even 5.5% by CY19. There is hope, however, as growth of year-over-year exports and imports seem to indicate a more stable environment after a bumpy 2015.
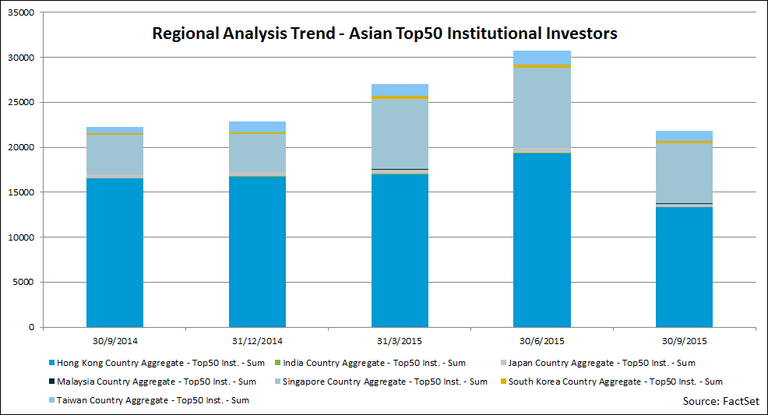
Asian investors, like their global peers, have been increasing their exposure to China over time. But are Asian investors depending on China stocks to make up a large percentage of their portfolios? When we use our Ownership Aggregates data to examine the largest 50 institutional investors in the region, we can see that in last quarter, China equities made up a much smaller percentage of Asian investments than in prior quarters, which seems to suggest that investors are indeed shifting their investments to other markets.
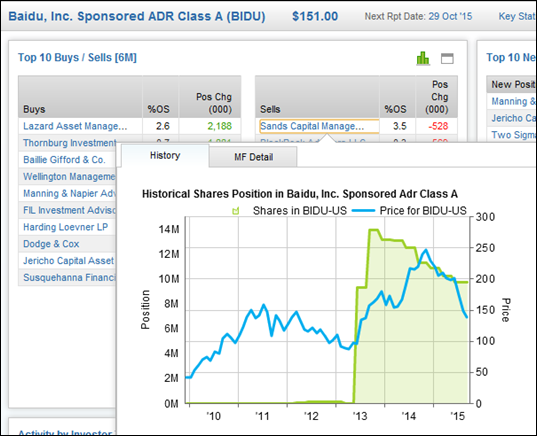
As a more specific example, using the ownership profile of Baidu, one of China's well-known Internet companies, we see that its institutional ownership is a mix of global investors. Using float, insider, and institutional ownership percentages and change over time, let's take U.S.-based Sands Capital Management as an example and dive into its ownership info of Baidu. In doing so, we can see that Sands has recently started selling shares of Baidu after a period of massive investment, hinting at an overall shift away from the country.
Understanding the exposure of a company means understanding the complex network of the company's key customers, suppliers, competitors, and strategic partners, including both direct and reverse relationships. With this information, we can model the ripple effects of extreme events, perform what-if scenarios, and discover anomalies and risk sources that are not yet fully reflected in the market assessment of individual security price.
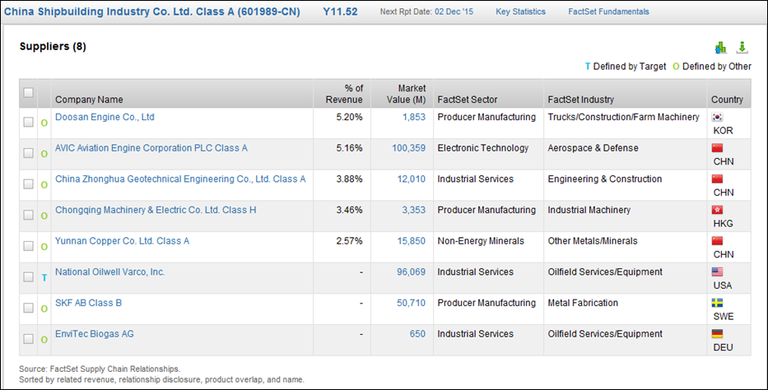
To illustrate, I tested the network of the China Shipbuilding Industry Corporation. Using supply chain data, I can dive into its suppliers and see whether companies outside of China will directly be impacted if one of its key customers is hurt by this slowdown. In this example, we can see that both a Korean and a Hong Kong company generate around 5% of their revenues from this China company and, as a result, might see this portion of their revenues decline in the coming quarters if CSIC were to cut down on investments.
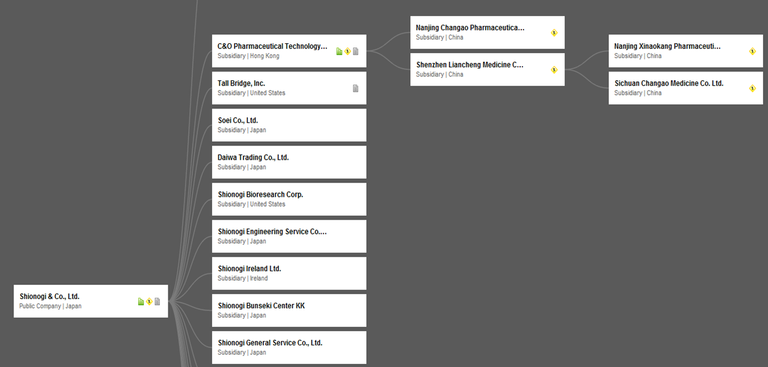
To understand your full exposure, you must first know how much you own and where you own it, which should include all subsidiaries that roll up to a parent company. Let's take Shionogi, a Japan-based company. Using entity data management we can discover that this company has two China-based subsidiaries, which means that it may be directly exposed to this slowdown, something we may not have known.
Now, when determining which companies are most exposed to the China slowdown, we might start with companies in the region, like Singapore Airlines. Using FactSet GeoRev data, which calculates the amount of revenue derived from a given region for a company and further correlates it to a normalized classification system, we learn that Singapore Airlines generates about 40% of its revenue from China. If China decelerates, it is most likely that Singapore Airlines will see a material impact on revenues.
But what about companies further afield? U.S.-based Avago, part of the S&P 500, owes almost 50% of its revenue to China, meaning that the coming years will affect Avago one way or another.
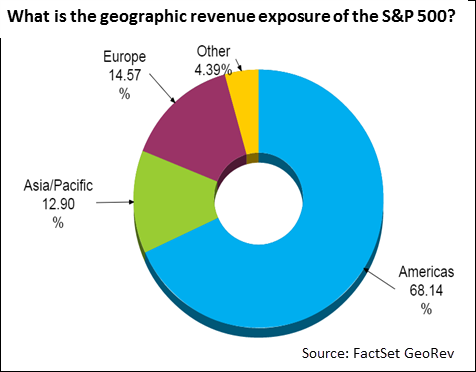
A traditional country-of-domicile approach would show the entire S&P 500 as not exposed at all to China. But applying a GeoRev filter to the S&P 500 paints a very different picture. We can see that the index has about 13% revenue exposure to Asia, of which 5.29% is to China.
We can further uncover exposure of specific companies to this market and realize that the S&P 500 companies most exposed to China are:
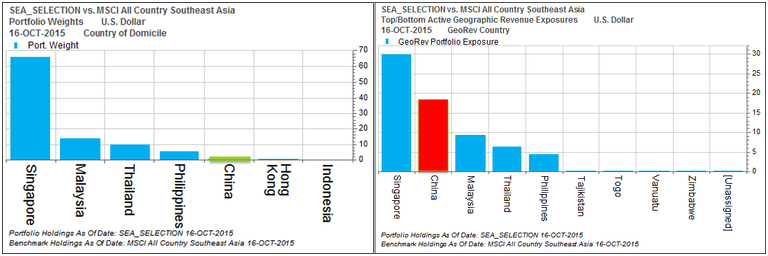
Let's look at an even more compelling example and apply the same view to a sample portfolio; we compared a traditional country-of-domicile view of the exposure of a portfolio on the right with a GeoRev view of the same portfolio on the left. The result couldn't be clearer: the weight of China jumped from 1.15% to 18.14%! For a manager looking to reduce geographic risk, this difference is critical.
Understanding your true exposure to China means understanding four key questions:
Knowing the answers to these questions will help you better understand your risk, improve your performance, and even satisfy regulatory needs.
Insight/Author%20Bios/Ed%20Piolet%20Insight.jpg)
Ed joined FactSet in 2014 and is based in Hong Kong.

Stress Testing Amid Rising Fears of an AI Bubble
Explore FactSet's stress testing strategies for risk managers amid AI bubble concerns, comparing current market sell-offs to the...
Stress Testing Investment Strategies: Combining Historical Data and Projected Assumptions (Podcast)
Explore portfolio stress testing to assess risk, including appropriate shock factors, historical scenarios and data, and your own...
Stress Test Your Portfolio Using 1990 and 2003 Middle East Conflict Scenarios
Explore how to leverage two FactSet hypothetical scenarios based on historical Middle East conflicts and stress test your...
Geopolitical Risk Scenarios: Stress Testing Investment Strategies Amid the War in Iran
Stay ahead of evolving markets with a stress testing module from FactSet. Use it as your starting point and build in your...
The information contained in this article is not investment advice. FactSet does not endorse or recommend any investments and assumes no liability for any consequence relating directly or indirectly to any action or inaction taken based on the information contained in this article.
