

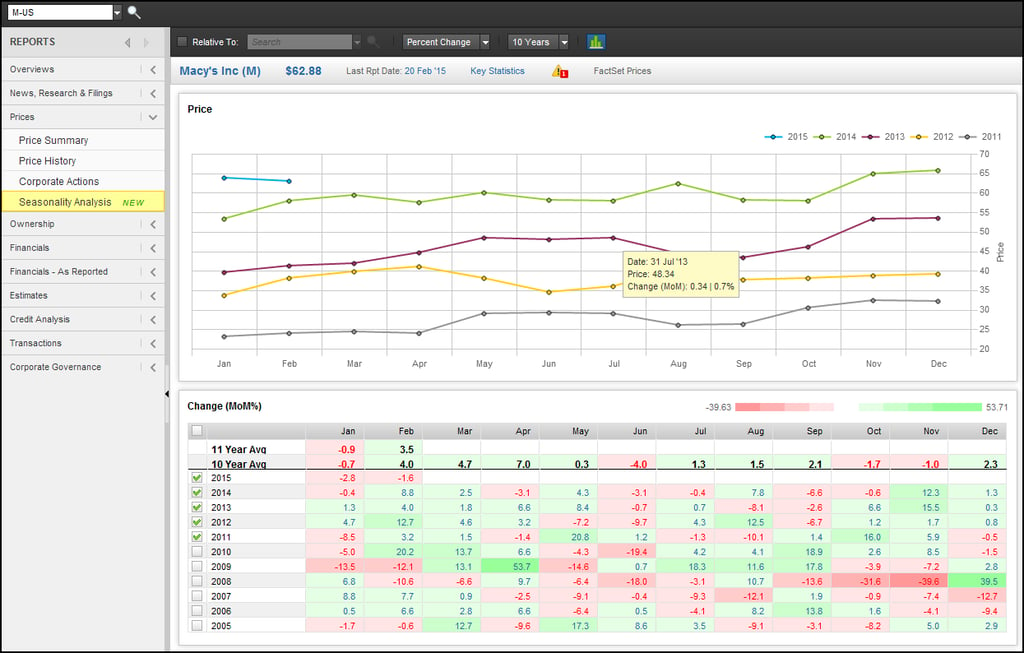
The Seasonality Analysis report combines key pricing information to analyze month-over-month change and year-to-year price performance of equities, commodities, futures, indices, exchange-traded funds, and mutual funds. Toggle seamlessly between report perspectives such as net or percent change, and the amount of data history using the report’s toolbar. This report also includes an interactive chart displaying monthly and yearly price performance, a heat map data table identifying percent and net price change, and a “relative to” option that reveals an identifier’s price performance relative to a benchmark. Additional relevant information such as price ratio, month-over-month change, and report date is also available by hovering over plots in the price chart.

Why AI Architecture Is the Key Competitive Variable in Financial Services
In this FactSet article we offer perspective and a strategic framework for firms across the financial sector to consider when...
Fractional Shares, Odd Lots, and the Overhaul of U.S. Market Data: What Data Teams Need to Know
Learn about the significant changes to plan for in 2026 if you work with real-time or historical U.S. equity data, including...
24/5 Trading: What It Is, Why It’s Coming, and What It Means for Your Data Stack
U.S. equity markets are moving toward near-continuous trading. If you work with real-time market data, this FactSet overview of...
Supply Chain Signals: Enhancing the Customer Momentum Strategy with Network Centrality
Explore enhanced customer momentum strategies using supply chain relationships and centrality measures to improve signal quality...
The information contained in this article is not investment advice. FactSet does not endorse or recommend any investments and assumes no liability for any consequence relating directly or indirectly to any action or inaction taken based on the information contained in this article.

