

The inclusion of unstructured content in financial analysis is quickly moving from the nascent to ubiquitous, across both quantitative and fundamental strategies. There is no better evidence of this than to look at the academic papers, products, and services that have sprouted up to demonstrate the insights and efficiencies mining sources such as Twitter, news outlets, or company conference calls can provide. One of the areas we’ve focused on recently has been drawing these insights from unstructured conference call data, which can hold value perhaps not easily discovered.
While the benefits of incorporating new, unique sources of data are vast, a number of challenges accompany them. For many, a major barrier to entry is developing a system to tag and map unstructured content so that it can interact with structured company data such as fundamentals, capital structures, or sell-side estimates. For example, how do you connect satellite images of Macy’s parking lots to fundamentals or estimates data? This very obstacle can deter many individuals from asking how a new content set can help meet investment objectives. To facilitate, FactSet simplifies the exercise of connecting the dots with an entity-centric symbology framework that allows connections to be made at the individual, security, product, or company level.
No matter your focus, whether it be quantitative or fundamentally driven, unstructured data presents an opportunity to differentiate yourself from your competition. The applications for quantitative models are clear; they empower users to mine, incorporate, and derive new insights that can supplement or potentially replace traditional factors. For firms with a fundamentally driven investment process, the challenge centers on identifying the “right” information and enabling analysts to exercise their judgment across more ideas, more efficiently.
As an example, let’s look at Tesla’s third quarter earnings call from 2016, using a combination of FactSet’s XML Transcripts and natural language processing packages (NLP) in Python.
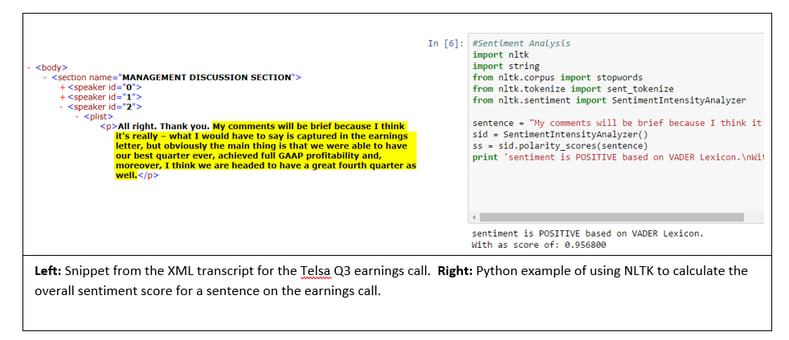
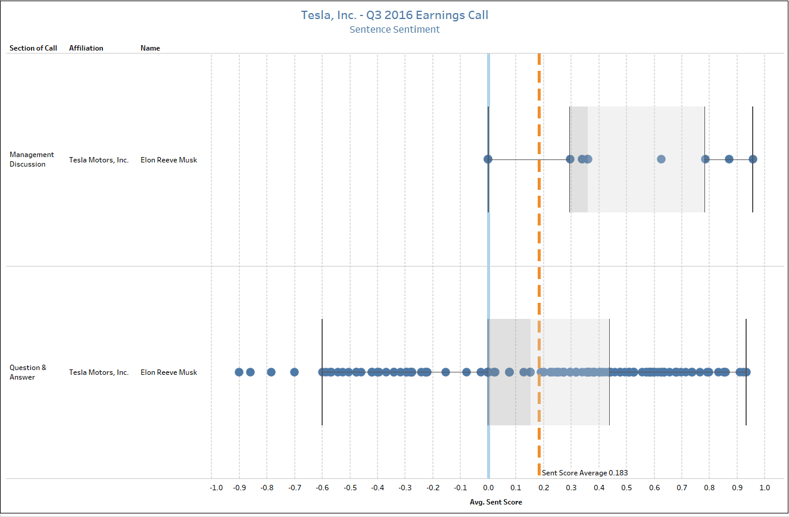
By using machine-readable files alongside Python’s Natural Language Toolkit package, we can diagram the call and identify how the sentiment of Elon Musk’s comments change between the Management Discussion Section (the prepared remarks) and the Question and Answer (off-the-cuff). In the visual below, we’re plotting the sentiment of the call, which has been quantified by leveraging a popular NLP algorithm known as the VADER model. Here we can see the average sentiment of the call was positive with a score of approximately 0.2, but the range of values varied quite dramatically from the Management Discussion to the Q&A, where the tone of the call took a turn for the worse upon mention of then-recent fatalities involving Tesla’s Autopilot.
A simple script like this addresses a critical challenge facing fundamental investors. In this scenario, an analyst would be able to receive an output from this call and immediately understand the average tone, notable headwinds, and if other analysts are overly bullish, bearish, or neutral. That type of intelligence allows analysts to create a benchmark that can be cross-referenced across their coverage lists, in turn allowing them to allocate their time accordingly. Said differently, if Tesla’s overall tone was positive, it may signal that more time could be directed to other ideas or calls where the outcome was more varied.
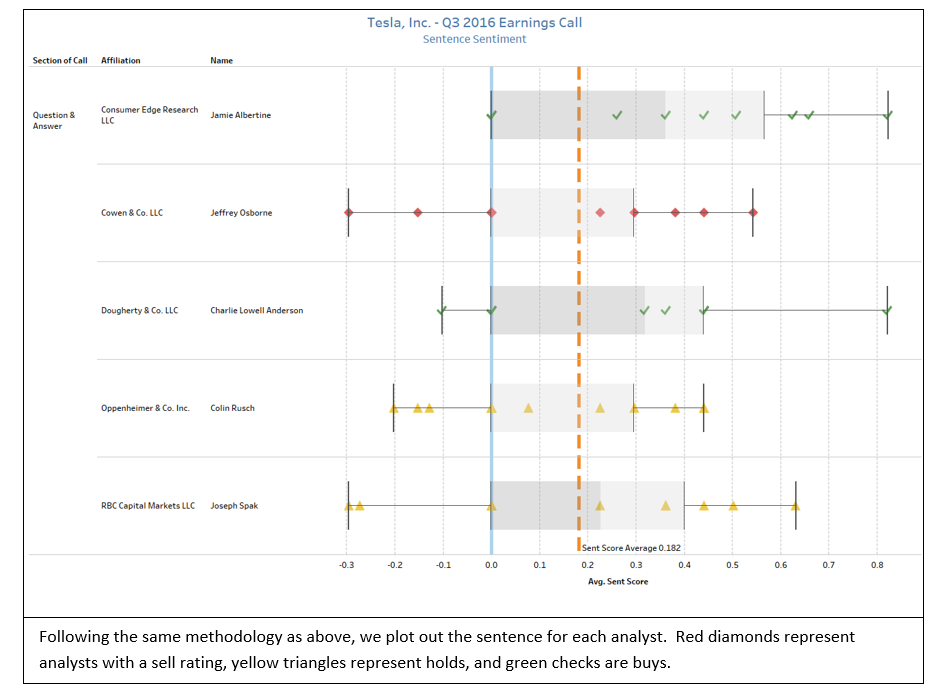
We can take this a step further by leveraging FactSet Symbology to join estimates data and gauge the sentiment from analysts based on their recommendations. By leveraging these datasets together, we can identify the tone of the analysts participating in the Q&A and identify their ratings across buy, hold, and sell categories.
For a quantitative investor, the ability to blend unstructured and structured content seamlessly is crucial. By leveraging FactSet Symbology at the individual security level, we can explore patterns and trends at a more granular level comparing transcripts and estimates. For example, are companies more likely to call on analysts with favorable ratings after or before a down quarter? Are analysts who participate on company earnings calls more accurate than their peers who do not? This example highlights how symbology at the individual security level unlocks the ability to augment or enhance existing models.
Using this method, we would have noticed analyst Colin Langan (UBS) had an overall sentiment score that was below the average of the call (0.111 vs 0.189) and one of the most negative sentences (-0.423). Shortly after the call, he released an updated research report titled Tesla Motors Q3 Good News to Turn Bad in Q4.
By employing an algorithm to do the work, we can begin to apply these techniques across a full history of transcripts to see how language, participation, and affiliation can serve as leading indicators for future performance. Approaches like this can enhance existing factors or introduce efficiencies to the often-manual task of listening to earnings calls.


Abstracting Vectorization to Jump Start AI and RAG Solutions
See how FactSet's vectorization system in its LLM wrapper simplifies data retrieval with AI. Discover RAG-enabled solutions,...
How RAG Helps Mitigate AI Inaccuracies
This article explores causes of data inaccuracy and the role of retrieval augmented generation (RAG) to help mitigate the issue.
Addressing the Evolving Challenges of Financial Market Data with Data-as-a-Service
This article summarizes today’s financial market data challenges, explores the key considerations for implementing a DaaS...
The Critical Role of APIs in Advanced AI Integration and Financial Innovation
APIs serve as the backbone for connecting Large Language Models (LLMs), generative AI, and data management systems like data...
The information contained in this article is not investment advice. FactSet does not endorse or recommend any investments and assumes no liability for any consequence relating directly or indirectly to any action or inaction taken based on the information contained in this article.

Insight/Author%20Bios/BadgeNLWF.svg)