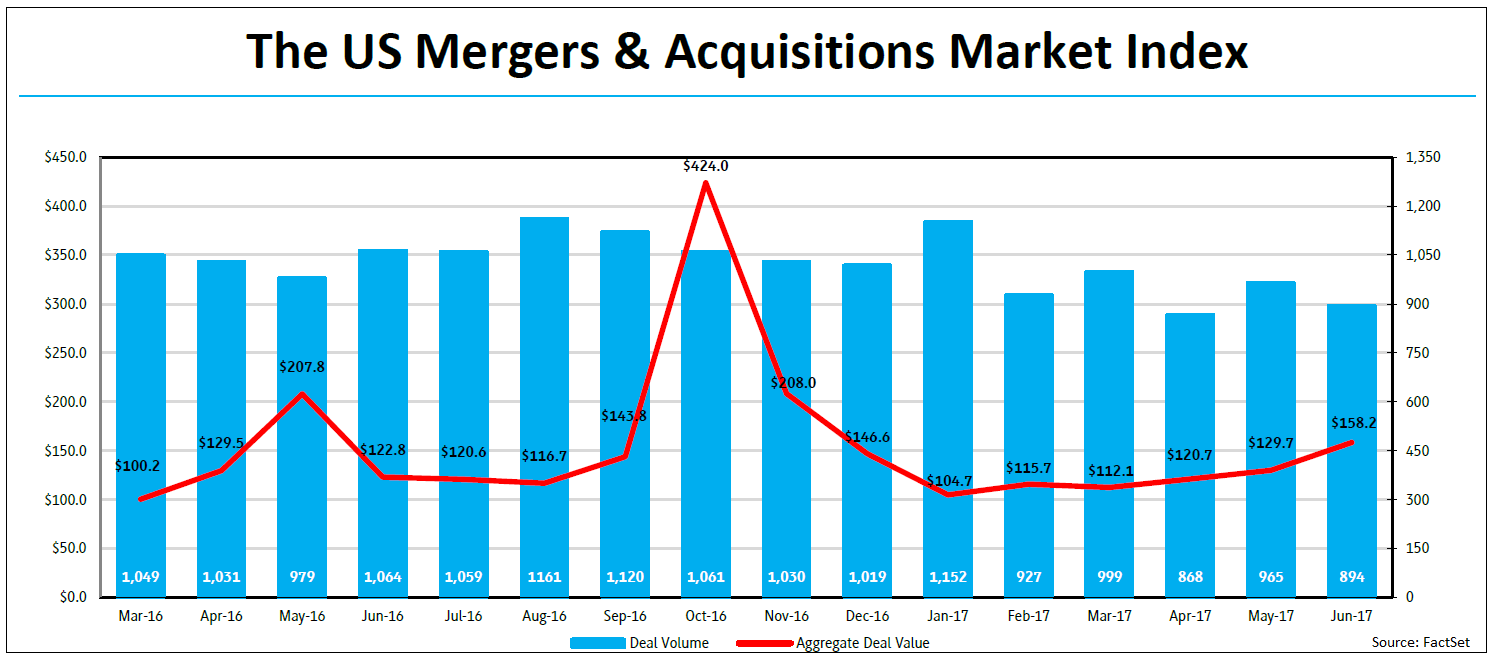
U.S. M&A deal activity decreased in June, down 7.4% with 894 announcements compared to 965 in May. At the same time, aggregate M&A spending increased; in June, 22.0% more was spent on deals compared to May.

Over the past three months, these sectors that have seen the biggest increases in M&A deal activity, relative to the same three-month period one year ago: Distribution Services (159 vs. 152), Transportation (64 vs. 58), Miscellaneous (16 vs. 13), and Government (10 vs. nine). Four of the 21 sectors tracked by FactSet Mergerstat posted relative gains in deal flow over the last three months, compared to the same three months one year prior.
| Sector By Activity |
|
|
|
| Target Sector |
L3M 6/30/17 Deal Count |
L3M 6/30/16 Deal Count |
Difference |
| Distribution Services |
159 |
152 |
7 |
| Transportation |
64 |
58 |
6 |
| Miscellaneous |
16 |
13 |
3 |
| Government |
10 |
9 |
1 |
| Finance |
367 |
367 |
0 |
| Energy Minerals |
40 |
41 |
(1) |
| Utilities |
69 |
72 |
(3) |
| Non-Energy Minerals |
58 |
62 |
(1) |
| Consumer Services |
214 |
219 |
(5) |
| Retail Trade |
99 |
104 |
(5) |
| Electronic Technology |
82 |
89 |
(7) |
| Consumer Durables |
46 |
61 |
(15) |
| Consumer Non-Durables |
67 |
83 |
(16) |
| Communications |
29 |
52 |
(23) |
| Health Technology |
93 |
117 |
(24) |
| Industrial Services |
123 |
149 |
(26) |
| Process industries |
106 |
133 |
(27) |
| Producer Manufacturing |
160 |
193 |
(33) |
| Technology Services |
427 |
468 |
(41) |
| Health Services |
122 |
164 |
(42) |
| Commercial Services |
376 |
468 |
(92) |
| Total |
2,772 |
3,074 |
(347) |
Over the past three months, these sectors that have seen the biggest declines in M&A deal volume, relative to the same three-month period one year ago: Commercial Services (376 vs. 468), Health Services (122 vs. 164), Technology Services (427 vs. 468), Producer Manufacturing (160 vs. 193), and Process Industries (106 vs. 133). Sixteen of the 21 sectors tracked by FactSet Mergerstat posted negative relative losses in deal flow over the last three months compared to the same three months one year prior, for a combined loss of 364 deals.
Topping the list of the largest deals announced in June were:
- Amazon.com, Inc. agreeing to acquire Whole Foods Market, Inc. for $13.4 billion
- Sycamore Partners Management LP's agreement to acquire Staples, Inc. for $6.7 billion
- EQT Corp. entering an agreement to acquire Rice Energy, Inc. for $5.6 billion
- Walgreens Boots Alliance, Inc. agreeing to acquire 2,186 stores and three distribution centers from Rite Aid Corp. for $5.2 billion
- Digital Realty Trust, Inc.'s deal to acquire DuPont Fabros Technology, Inc. for $5 billion
FactSet Flashwire Monthly Report
Download the full report for more including:
- Key trend information for the Overall and Middle M&A Markets, such as deal volume, deal value, mega-deals, leading buyers, leading industries, leading sectors, cross-border deals, US regional deals, average P/E, average premiums, payment methods, and much more
- Industry reports on the Internet, Telecommunications, Healthcare, Banking, and much more
- Special reports on technology, the public and private M&A markets, cancellation fees, industry activity, etc.
- Leading financial and legal advisor rankings
