
By Dave Nadig | September 15, 2016
I have to admit I have a bit of a love-hate relationship with Smart Beta. On the one hand, I cut my teeth in the early ‘90s working for Wells Fargo Nikko Investment Advisors, where some of the most interesting products we had were Tilts & Timing strategies which would be firmly in “Smart Beta” territory today. Also, I generally think investors having more tools is a good thing.
Still, I always worry with more complex products whether investors truly understand what they’re buying, and whether they will use all these sharp new tools wisely. So I finally grabbed some data to try and back up my concerns.
The normal way of thinking about this problem is to look at the difference between the time-weighted returns of a fund (The SPDR S&P 500 returned 1.35% in 2015) and the dollar-weighted returns of the same fund (The average dollar invested in SPY returned -4.9% in 2015). Doing so, theoretically, lets you account for investors’ tendency to chase returns—buying high and selling low.
This is hardly a new idea. Boston-based Dalbar has been publishing their Quantitative Analysis of Investor Behavior since 1994 using these methods, and it’s shown, month after month, year after year, that investors get the timing wrong far more often than not. Here’s a tidbit from their latest study:
| Investor Returns | Inflation | S&P 500 |
Barclays Aggregate Bond Index |
|||
| Equity Funds | Asset Allocation Funds | Fixed Income Funds | ||||
| 30 Year | 3.66 | 1.65 | 0.59 | 2.60 | 10.35 | 6.73 |
| 20 Year | 4.67 | 2.11 | 0.51 | 2.20 | 8.19 | 5.34 |
| 10 Year | 4.23 | 1.89 | 0.39 | 1.88 | 7.31 | 4.51 |
| 5 Year | 6.92 | 3.28 | 0.10 | 1.58 | 12.57 | 3.25 |
| 3 Year | 8.85 | 3.81 | -1.76 | 1.07 | 15.13 | 1.44 |
| 12 Month | -2.28 | -3.48 | -3.11 | 0.95 | 1.38 | 0.55 |
Just look at the returns of actual investors in equity funds vs. the S&P 500, and the evidence is pretty damning. Left to their own devices, investors get it wrong. Over the past 30 years, the average investor return in equity funds is just 3.66%, compared to 10.35% for the S&P 500.
To be fair, there are criticisms of this methodology; notably, that a small fund with consistent inflows will look like it has “bad” investor returns because of how IRR calculations are done (a point made in an excellent Vanguard paper a few years ago). Still, it’s the best tool we have for analyzing the performance-chasing phenomenon.
With that in mind, I was curious how Smart Beta investors have been doing relative to their passive brethren, so I ran a handful of studies looking at different sets of funds. The results tell a cautionary tale, but one with a sliver of hope at the end.
To understand how well or poorly ETF investors are using smart beta funds, you first have to benchmark their performance. After all, as the Dalbar study shows, investors are bad at timing in all types funds – so simply finding out that they are bad at timing smart beta ETFs would not be interesting.
To establish this benchmark, we looked at the performance of investors in the three major S&P 500 ETFs. Beyond the benchmarking aspect, we were also interested to see if the performance of investors differed between the three funds. After all, the stereotype in the ETF industry is that State Street’s SPDR products, particularly the flagship S&P 500 SPDR (SPY), are “Traders'” funds, whereas Vanguard’s equivalents (like its S&P fund, VOO) are “Investors'” funds, and the iShares line up (say, its S&P 500 ETF, IVV) somewhere in the middle. You would expect, therefore, that SPY investors, as a class, would be more likely to be trading themselves into a hole than the Vanguard investors.
To test this, we ran the dollar-weighted performance of each fund over each of the last five years, as well as YTD for 2016 (annualized):
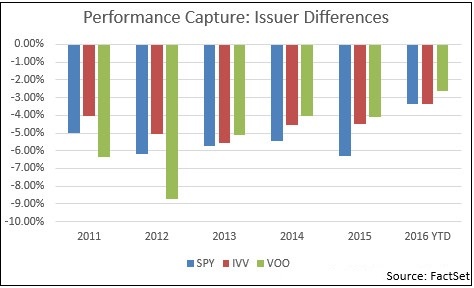
The “Performance Capture” here is the difference between the Time-Weighted returns of each fund and the Dollar-Weighted returns. So the -5% for SPY in 2011 means “on a dollar weighted basis, investors did 5% worse than the actual returns of SPY.” In this case, we find that ETF investors—like fund investors—all do worse than the market as a whole. SPY investors did slightly worse than IVV and VOO investors, with the notable exception of 2011-2012, when Vanguard investors seemed to get their timing particularly wrong. So what’s going on here?
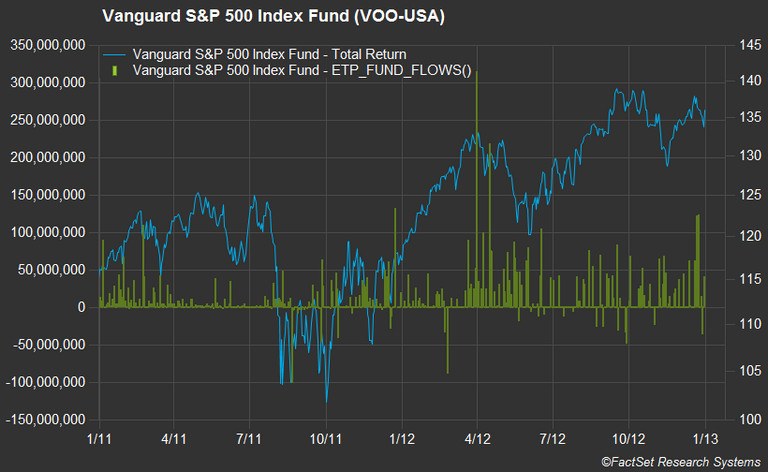
Simply put, Vanguard investors, while generally piling in through the period, put a particularly large amount of money to work in spring 2012, right before the market pulled back. Worse, in 2011, they sold near the bottom. That tends to be the story for any fund that looks particularly bad in this kind of analysis and pretty much what we’re testing for. Again, just to be super clear here—this is not about the funds: all three S&P 500 funds tracked their index so closely they’re indistinguishable on a chart. This is about the behavior of investors.
With this as a baseline, I wanted to test how some of the “hotter” segments of smart beta have been doing over the past few years. The short answer is: not great.
Low-Vol funds arguably put smart beta on the map with many investors, as a handful of funds started exploiting the so called “low vol anomaly,” wherein seemingly less-risky stock were delivering superior performance (in violation of the core market concept that higher risk leads to higher returns). These funds were (and in many cases continue to be) marketed as core vehicles, directly competitive with a traditional broad-market index.
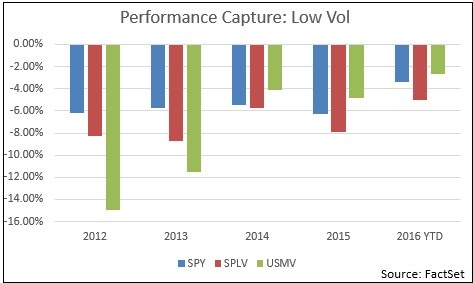
Results here are a mixed bag, but not especially favorable to smart beta.
In the beginning of the period (2012-2013), investors plowed money into these strategies, at a time when they weren’t necessarily delivering as promised. In the case of iShares Edge MSCI Min Vol ETF, investors did substantially worse than average investors in SPY. To put these numbers in context: the actual returns for the S&P 500 in 2012 were 15.74%, and USMV returned 10.98%. The average USMV investor, however, lost 4% in the year due to bad timing (!).
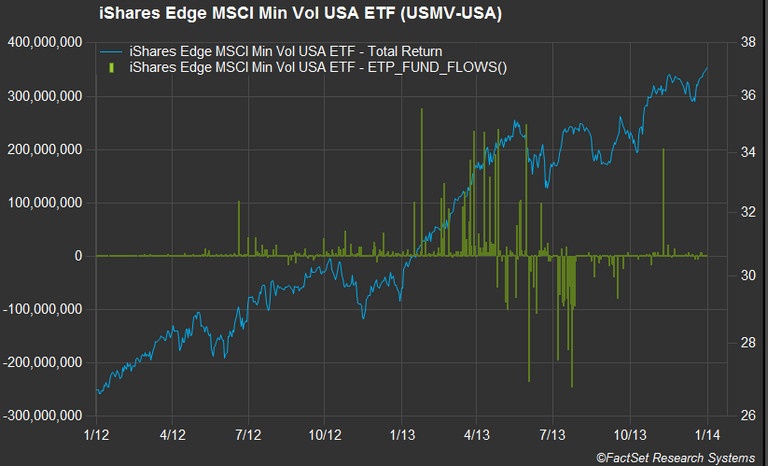
How is that possible? Simple. Most of the money that went into USMV came in in 2012 after the biggest gains of the year were already booked; it arrived just in time to ride out the fall downturn. In 2013, the money flowed in, able to at least capture much of the wins, but then a significant portion sold out in the summer doldrums, missing the rally into the end of the year. More recently, smart beta investors have become somewhat smarter investors, particularly for USMV.
We can see a similar pattern in almost any section of the market where a factor got “hot,” whether it was marketed as a long-term core position or a tactical rotation play. Even stodgy old dividends show the same pattern:
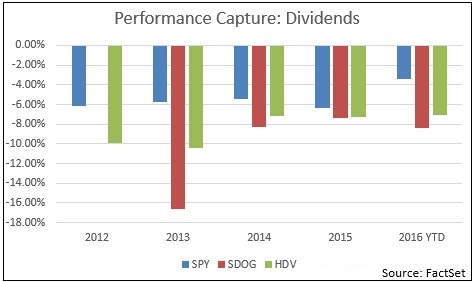
Again, the point here is not about the funds—it’s about investors desire to “chase” something that’s perceived as in favor. The Alps Sector Dividend Dogs ETF, which looks “bad” here, was in fact having an incredible first full year in 2013, beating the S&P 500 by over 2% on a year when the S&P closed up over 32%. Investors noticed, but not until most of the performance was already in the bank. In every year studied, the timing gap for smart beta funds was bigger than it was for SPY, but again, recently, the game is narrowing.
My suspicion is that how funds like this are sold is as much at stake here as how the funds actually perform. After seeing segment after segment where “Smart Beta” investors seemed, well, not-so-smart, I found a group of funds where investors seemingly did better than their indexing peers, in particular two funds: the PowerShares FTSE RAFI 1000 (PRF) and iShares Edge MSCI USA Quality Factor ETF (QUAL).
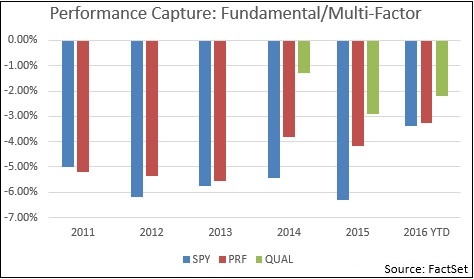
PRF is one of the oldest “Smart Beta” funds on the market, having been launched way back in 2005, and as such, the marketing buzz around it isn’t at fever pitch. Flows into PRF are generally slow, steady, and generally positive. QUAL, for its part, was launched in partnership with the Arizona State Retirement System (which still owns 6% of the fund) and is really an institutional strategy in ETF clothing. In the case of both funds, the numbers suggest real, long-term buy and hold investing is at work.
That, frankly, gives me hope. Factor investing and smart beta are interesting investment technologies, but most of the academic research suggests they are either really regime specific (working only in one part of a business or market cycle) or require a significant amount of time to work out (sometimes north of seven years).
That kind of patience can be hard to come by in these 24-hour news-cycle days. But maybe, just maybe, we can educate investors to a better result. The improving results of the past few years suggest that might be the case.

How Private Capital Is Powering the Johor-Singapore Special Economic Zone
This FactSet analysis provides insight into the early stage of the JS-SEZ progress with key data points. Stay informed on how...

How Transaction Cost Analysis Is Evolving from Compliance Tool to Trading Decision Support
Discover insights to further strengthen your TCA capabilities in this FactSet analysis. Consider how you can make the most of TCA...
The information contained in this article is not investment advice. FactSet does not endorse or recommend any investments and assumes no liability for any consequence relating directly or indirectly to any action or inaction taken based on the information contained in this article.