

As the year has turned to 2017, industry analysts have made a number of projections for the S&P 500 for 2017. Here, we provide an overview of these projections and an overview of historical trends regarding these predictions.
For 2017, the bottom-up EPS estimate (which reflects an aggregation of the median EPS estimates for all of the companies in the index) on December 31 was $132.89. If $132.89 is the final number for the year, it will mark a new record-high EPS number for the index. However, what is the likelihood that $132.89 will be the final EPS value for the S&P 500 in 2017? How accurate is the bottom-up EPS estimate one year in advance?
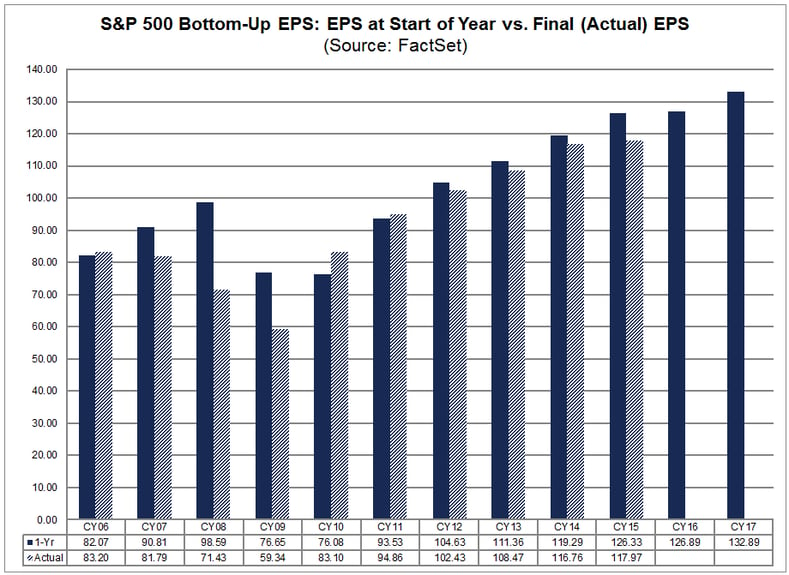
Over the past 20 years, the average difference between the bottom-up EPS estimate at the beginning of the year and the final EPS number for that same year has been 7.2%. In other words, industry analysts on average have overestimated the final EPS number by about 7.2% one year in advance. Analysts overestimated the final value (i.e., the final value finished below the estimate) in 14 of the 20 years and underestimated the final value (i.e., the final value finished above the estimate) in the other six years. For the purposes of this analysis, the final EPS number for a year is the EPS number recorded two months after the end of each calendar year (February 28) to capture the actual annual EPS results reported by most companies during the fourth quarter earnings season.
However, this 7.2% average includes three years in which there were substantial differences between the bottom-up EPS estimate at the start of the year and the final EPS number: 2001 (+36.6%), 2008 (+38.0%), and 2009 (+29.2%). If these three years are excluded, the average difference between the bottom-up EPS estimate one year prior to the end of that year and the final EPS number for that year has only been 2.3% (over the past 20 years).
If we apply the overall average overestimation of 7.2% to the 2017 EPS estimate, the final value for 2017 would be $123.39. If we apply the average overestimation of 2.3% excluding the years 2001, 2008, and 2009, the final value for 2017 would be $129.83.
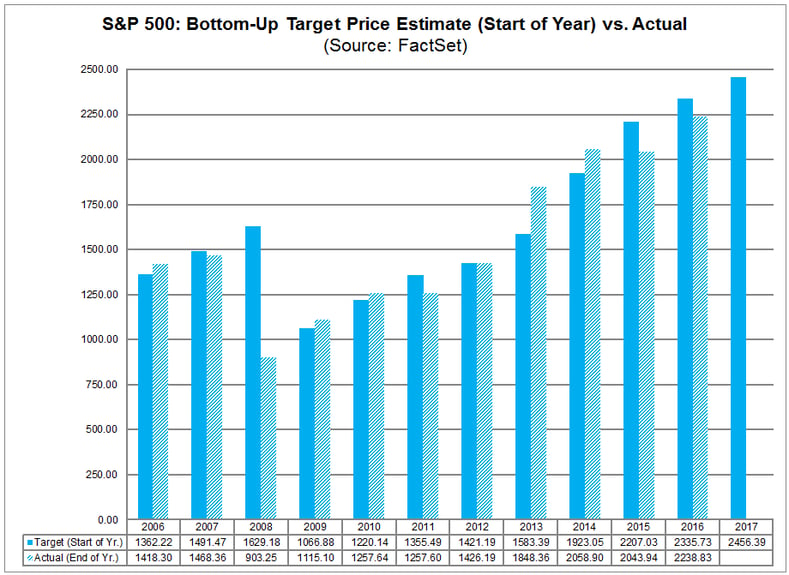
As I wrote yesterday, analysts are also projecting a 10% price hike for S&P 500 in 2017. But they may be overestimating that number as well.
The forward 12-month P/E ratio for the S&P 500 was 16.9 on December 31, based on the closing price (2238.83) and forward 12-month EPS estimate ($132.85) on that date. Given the record high values driving the “P” in the P/E ratio, how does this 16.9 P/E ratio compare to historical averages? What is driving the increase in the P/E ratio?
The forward 12-month P/E ratio of 16.9 is above the three most recent historical averages: 5-year (15.0), 10-year (14.4), and 15-year (15.3). However, it is slightly below the 20-year average (17.2), and also well below some of the peak forward 12-month P/E ratios recorded in the late 1990s.
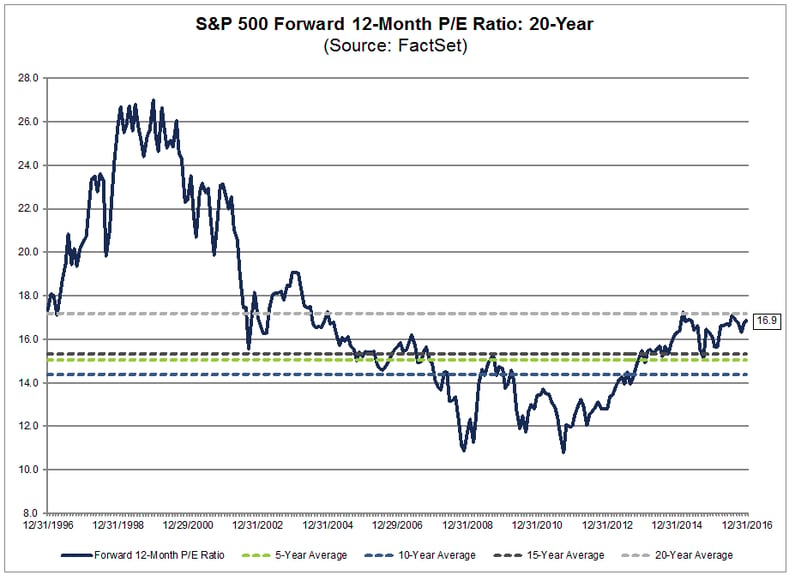
At the start of the year (December 31, 2015), the forward 12-month P/E ratio was 16.1. Over the past year, the price of the S&P 500 increased by 9.5% (to 2238.83 from 2043.94), while the forward 12-month EPS estimate increased by 4.7% (to $132.85 from $126.89). Thus, the rise in the “P” was the main contributor to the expansion of the P/E ratio over the past year.
It is interesting to note that analysts are projecting record-level EPS for the S&P 500 for three of the next four quarters. At this time, the Q3 2016 quarter has the record for the highest bottom-up EPS at $31.35. While the bottom-up estimate for Q1 2017 ($30.56) on December 31 was below this number, the bottom-up EPS estimates for the following three quarters all exceeded $31.35 as of December 31. Therefore, if analysts were not projecting record-level earnings over three of the next four quarters, the forward 12-month P/E ratio would be higher than 16.9.
While earnings are projected to be nearly flat in CY 2016, double-digit earnings growth is expected for CY 2017. As of December 31, the estimated earnings growth rate (aggregating company-level EPS estimates from industry analysts) for CY 2017 was 11.5%. If 11.5% is the final growth rate for the year, it will mark the highest annual earnings growth for the index since 2011 (12.5%). Ten of the 11 sectors are expected to report higher earnings in 2017 relative to 2016. Four of these 10 sectors are expected to report double-digit earnings growth: Energy, Materials, Financials, and Information Technology.
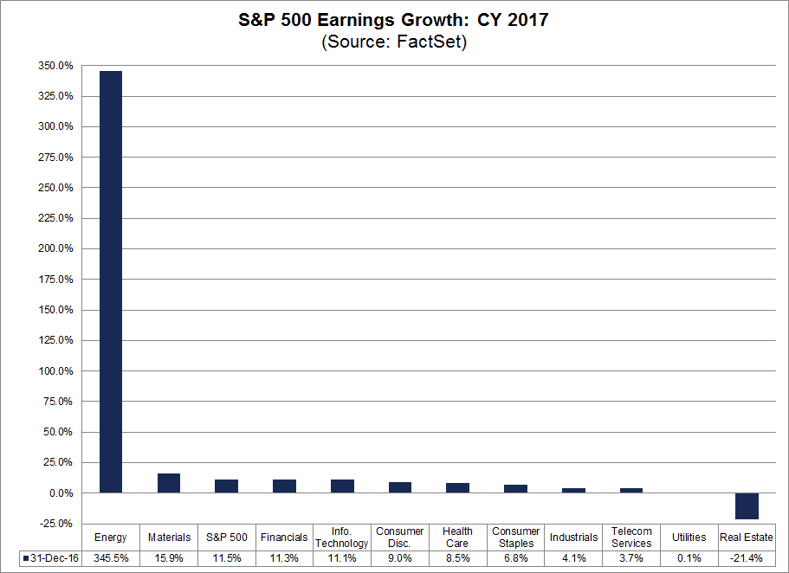
The Energy sector is projected to report the highest year-over-year earnings growth at 345%. Five of the six subindustries in this sector are predicted to report an increase in earnings: Oil & Gas Exploration & Production (N/A), Oil & Gas Equipment & Services (543%), Integrated Oil & Gas (151%), Oil & Gas Refining & Marketing (53%), and Oil & Gas Storage & Transportation (16%). The only subindustry expected to report a year-over-year decline in earnings is the Oil & Gas Drilling (-183%) subindustry.
The Materials sector is expected to report the second highest earnings growth at 15.9%. All four industries in this sector are projected to report earnings growth for 2017, led by the Metals & Mining industry (91%).
The Financial sector is predicted to report the third highest earnings growth at 11.3%. All five industries in this sector are expected to report earnings growth for 2017, led by the Insurance (17%), Diversified Financial Services (15%), and Capital Markets (13%) industries. The Banks industry is expected to report earnings growth of 9%.
The Information Technology sector is projected to report the fourth highest earnings growth at 11.1%. All seven industries in this sector are predicted to report earnings growth, led by the Internet Software & Services (20%) and Semiconductors & Semiconductor Equipment (13%) industries.
As of December 31, the estimated revenue growth rate (aggregating company-level estimates from industry analysts) for CY 2017 was 5.9%. If 5.9% is the final growth rate for the year, it will mark the highest annual revenue growth for the index since 2011 (10.6%). All 11 sectors are predicted to report revenue growth for the quarter, led by the Energy and Information Technology sectors. This marks the highest sales growth projected since 2011.
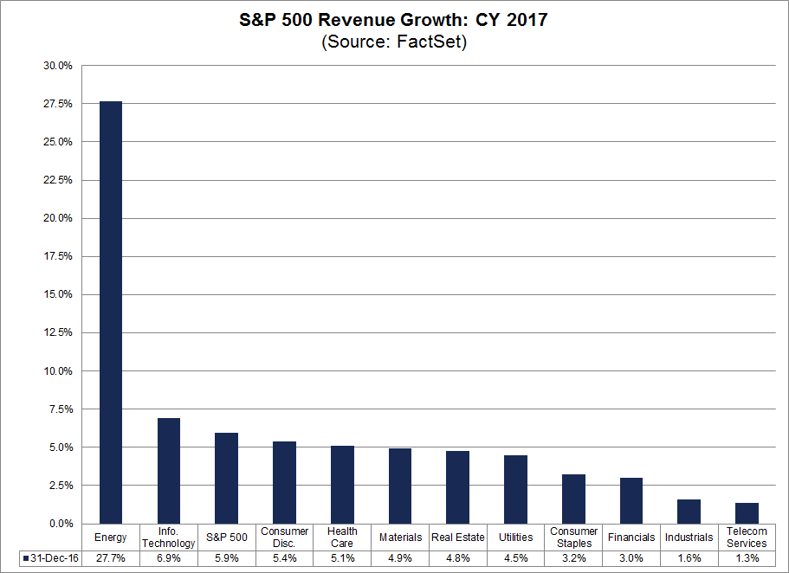
The Energy sector is projected to report the highest year-over-year revenue growth at 27.7%. Five of the six sub-industries in this sector are predicted to report an increase in revenues: Integrated Oil & Gas (37%), Oil & Gas Exploration & Production (30%), Oil & Gas Refining & Marketing (22%), Oil & Gas Equipment & Services (11%), and Oil & Gas Storage & Transportation (9%). The only sub-industry expected to report a year-over-year decline in revenues is the Oil & Gas Drilling (-18%) sub-industry.
The Information Technology sector is projected to report the second highest revenue growth at 6.9%. All seven industries in this sector are predicted to report earnings growth, led by the Internet Software & Services (19%) and Semiconductors & Semiconductor Equipment (8%) industries.
Five sectors are projected to report revenue growth between 4.5% and 5.5% for 2017. The remaining four sectors are projected to report revenue growth between 1.2% and 3.2% for the year.
Analysts are most bullish on Health Care and Technology for 2017, but bearish on Consumer Staples, Energy, and Utilities. For a complete report on the latest targets and ratings, see my January 4 Targets and Ratings report.
As a reminder on methodology, the index-level EPS estimates and index-level target price estimates reflect an aggregation of company-level median estimates. The index-level earnings growth estimates and index-level revenue growth estimates reflect an aggregation of company-level mean estimates. All of the metrics in this report reflect values as of December 31.


Mr. John Butters is Vice President and Senior Earnings Analyst at FactSet. His weekly research report, “Earnings Insight,” provides analysis and commentary on trends in corporate earnings data for the S&P 500 including revisions to estimates, year-over-year growth, performance relative to expectations, and valuations. He is a widely used source for the media and has appeared on CNBC, Fox Business News, and the Business News Network. In addition, he has been cited by numerous print and online publications such as The Wall Street Journal, The Financial Times, The New York Times, MarketWatch, and Yahoo! Finance. Mr. Butters has over 15 years of experience in the financial services industry. Prior to FactSet in January 2011, he worked for more than 10 years at Thomson Reuters (Thomson Financial), most recently as Director of U.S. Earnings Research (2007-2010).

S&P 500 Reporting Highest Net Profit Margin in More Than 15 Years
Explore S&P 500 Q2 results in this FactSet earnings report. Use our quantitative analysis for insight on net profit margins at...
Alphabet Drives S&P 500 Earnings Growth to Highest Level Since 2021 On Valuation Gains
FactSet S&P 500 earnings analysis: Explore the sectors and companies with the largest contribution to earnings growth in Q2.
S&P 500 Earnings Season Update: July 24, 2026
FactSet report on S&P 500 earnings: Explore Q2 earnings season results, including an unusually large EPS beat, earnings growth,...
Are “Magnificent 7” Companies Still Top Contributors to S&P 500 Earnings Growth for Q2?
Explore our FactSet S&P 500 earnings report for the Mag 7 trends in Q2 earnings growth. Learn which companies are top-5...
The information contained in this article is not investment advice. FactSet does not endorse or recommend any investments and assumes no liability for any consequence relating directly or indirectly to any action or inaction taken based on the information contained in this article.
