

Stress testing is an essential part of any risk management process, and uncertainty over the level and term structure of interest rates is a recurring theme that will be with us for some time (for the UK at least).
FactSet recently expanded our stress testing capabilities to include the FactSet Multi-Asset Class (MAC) risk model that opens stress testing up to a new range of asset classes. Not only can you sample shocks from a variety of markets, but now you can also assess the impact of any shock on equities, bonds, commodities, and currencies simultaneously. Unsurprisingly, the question of stress testing interest rate movements has come up several times, and the goal of this article is to review the methods that are available on FactSet.
Bond sensitivities to key rate points are a part of the analytics we run for any bond or related derivative, making it easy to re-price fixed income under an interest rate scenario [Fig.1], with full control over term structure. This is great for a pure fixed income portfolio and requires no underlying risk model, but is blind to correlations with other asset classes.
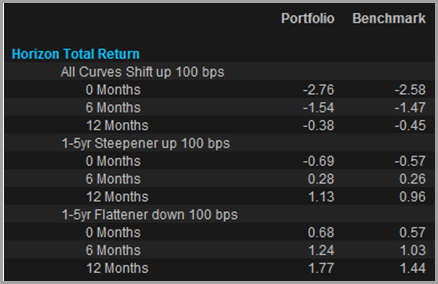
Figure 1: Bond portfolio total return under interest rate scenarios from FactSet Portfolio Analysis
A risk model monitors a set of market factors and records the correlations and performance of these factors over time. A multi-asset risk model allows you to wind the clock back and re-run a historic event on your current portfolio by applying current portfolio factor exposures to historic factor returns. This is our second form of stress testing. It takes into account multiple asset classes and the correlations between them, but limits us to scenarios that have actually occurred.
The next techniques share the same underlying method; however, the only difference between them is what you use as the input to define the shock. That method involves taking any daily change series (market indices, rates, currencies, styles) and calculating the beta to all risk model factor returns, describing how each risk factor moves with the shock series. We then specify a change in that shock series – e.g. a 30% decline in the price of oil or a 20% dip in a bond index – and use the factor relationships to re-price all assets.
3a. Shock a yield series/bond index directlyThis method could be applied to an interest rate series, to a bond index, or to any of the interest rate factors in the FactSet MAC risk model (all 30 curves are represented by 17 points). We can see the impact on all asset classes, taking into account correlations, so this is starting to become very useful from a multi-asset perspective. But shock an interest rate directly and we are limited to a single point on the curve, or shock a bond index and it may be difficult to isolate the impact of yield changes from other market movements.
3b. Customize a series to control term structure changesIs there any way to control the shape of a yield curve shock and see the impact on multiple asset classes, without relying on historic events? The FactSet MAC model analyzes curve movements using principal component analysis (PCA) – a technique often used to isolate shift, twist and butterfly movements in yield curves – and we can borrow this idea for use in stress testing.
Using principal component analysis to capture yield curve movements and represent shift/twist/butterfly is nothing new; in fact it is used in several of the third party risk models that we provide on FactSet. The process involves taking a series of standardized daily changes for each point along a given curve (17 points along the EUR curve in my example), running PCA on these series, and extracting the component time-series. We can first examine the relationship between each PC and each yield curve point directly:
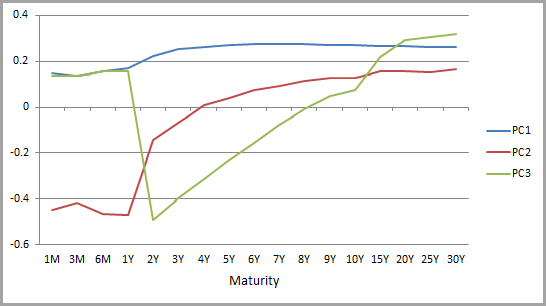
Figure 2: Loading of principal components 1 to 3 across tenors
These shapes suggest that the first PC has a positive relationship with all points along the curve, the second has an inverse relationship at the short end and positive at the long end, and the third PC has a U-shaped relationship. In other words, they represent shift, twist, and butterfly. A plot of variance explained by each PC [Fig.3] shows, as expected, that the PC we’re assuming to be shift (PC1) explains the vast majority (79%) of historic variability in term structure, and that the first three effects combined explain around 96%:
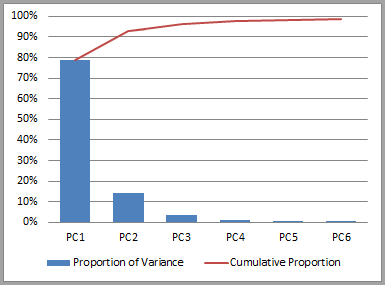
Figure 3: Variance explained by PCs
The time-series of the first three PCs can then be used as inputs for shift/twist/butterfly stress tests, providing predicted returns for every portfolio or benchmark asset. To rule out credit effects, I first looked at an index of European treasuries:
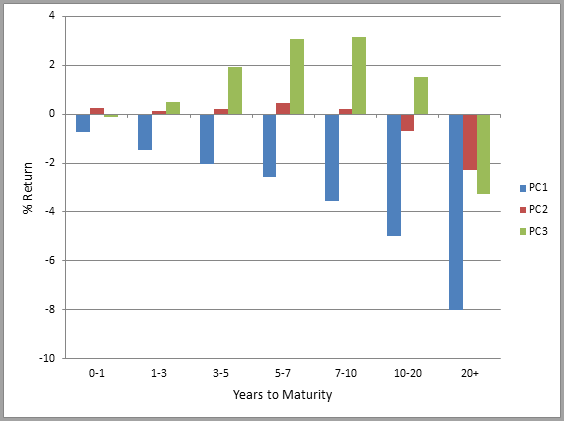
Figure 4: Stress Test by bond maturity
The x-axis of this chart represents index constituents bucketed by years to maturity and the y-axis is the stress test predicted return for each group. PC1 shows a negative return across all tenors (upward shift), PC2 shows a slight positive return at the shortest tenors and a negative return at the longest tenors (steepening), and finally PC3 shows a positive butterfly return profile.
So far, these results only confirm what we already knew about bond sensitivities, but this analysis becomes a lot more powerful when we expand the scenario to a multi-asset class portfolio. A shift or twist series can now be used in a stress test to re-price any type of asset, via the relationship between EUR shift or twist and equity factors, commodity factors, or currencies.
This report, from FactSet’s Portfolio Analysis, does just this for a global multi-asset portfolio:
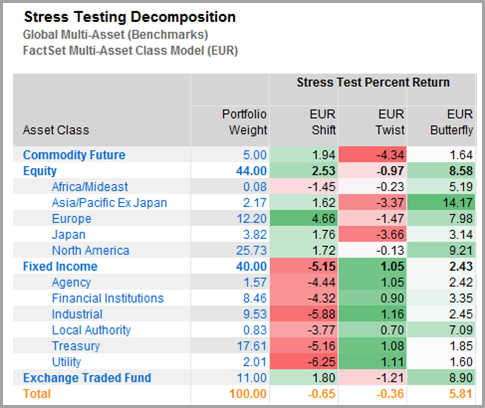
Figure 5: PCA stress test returns by asset class
Whether or not the effort required to implement this PCA method pays off will depend on the amount of granularity you require. For example, a comparison of results from the lengthy PCA shift method and the simple shift (mentioned above in 3a) reveals results relatively similar in direction:
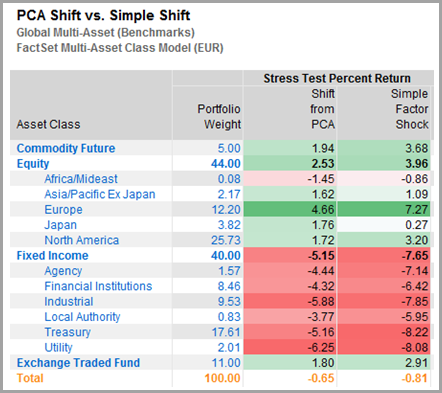
Figure 6: Simple shift va. PCA shift stress test returns
Regardless of the exact approach used, a risk model is key to applying a stress test across asset classes and to capturing correlations effectively. The examples above were set up simply to draw some comparisons between the different stress testing methods and highlight the flexibility of our approach – I hope they have provided some food for thought.

Gold Mining Equity Analysis with the Custom Risk Module
Explore the process to build a bespoke risk model in this FactSet analysis, including data gathering, exposure outlier treatment...
Stress Testing Amid Rising Fears of an AI Bubble
Explore FactSet's stress testing strategies for risk managers amid AI bubble concerns, comparing current market sell-offs to the...
Stress Testing Investment Strategies: Combining Historical Data and Projected Assumptions (Podcast)
Explore portfolio stress testing to assess risk, including appropriate shock factors, historical scenarios and data, and your own...
Stress Test Your Portfolio Using 1990 and 2003 Middle East Conflict Scenarios
Explore how to leverage two FactSet hypothetical scenarios based on historical Middle East conflicts and stress test your...
The information contained in this article is not investment advice. FactSet does not endorse or recommend any investments and assumes no liability for any consequence relating directly or indirectly to any action or inaction taken based on the information contained in this article.

