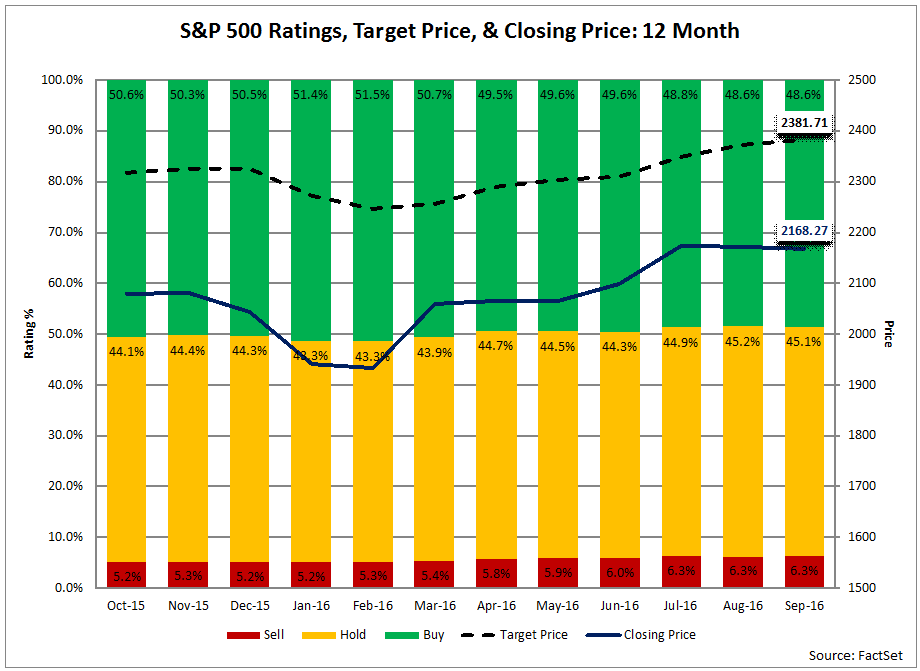
During the third quarter, the S&P 500 index recorded an increase in value of 3.3% (to 2168.27 from 2098.86). During the past 12 months, the S&P 500 index saw an increase in value of 12.9% (to 2168.27 from 1920.03). Where do industry analysts believe the price of the index will go from here?
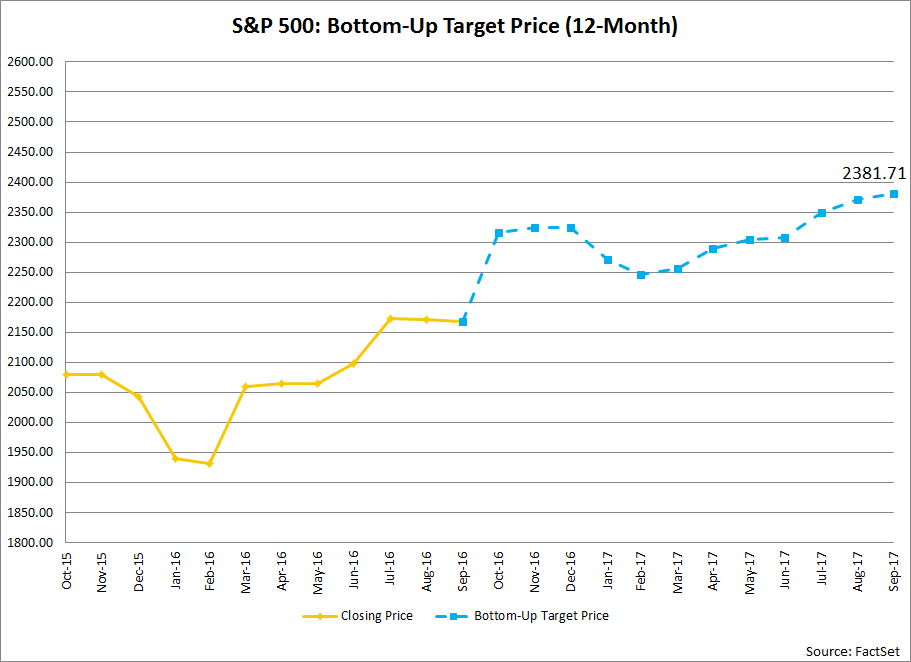
Industry analysts in aggregate predict the S&P 500 will see a 9.8% increase in price over the next 12 months. This percentage is based on the difference between the bottom-up target price and the closing price for the index at the end of September. The bottom-up target price is calculated by aggregating the mean target price estimates (based on company-level estimates submitted by industry analysts) for all the companies in the index. On September 30, the bottom-up target price for the S&P 500 was 2381.71, which was 9.8% above the closing price of 2168.27.

At the sector level, the Health Care sector had the largest upside difference between the bottom-up target price and the closing price (+14.2%), while the Industrials sector had the smallest upside difference between the bottom-up target price and the closing price (+6.3%).
How accurate have the industry analysts been in predicting the future value of the S&P 500?
At the end of September 2015 (one year ago), the bottom-up target price was 2317.68. Compared to the actual closing price of 2168.71 at the end of September 2016, industry analysts overestimated the price of the index by 6.9% one year ago.
Over the prior year (October 2014 to September 2015), the average difference between the bottom-up target price estimate at the end of the month one year ago and the final price for the index at the end of the same month one-year later has been +9.4%. In other words, industry analysts on average have overestimated the final price of the index by 9.4% at the end of each month during the previous year.
Over the prior five years (October 2010 to September 2015), the average difference between the bottom-up target price estimate at the end of the month one year ago and the final price for the index at the end of that same month one year later has been +1.4%. In other words, industry analysts on average have overestimated the final price of the index by 1.4% at the end of each month during the previous five years.

Small Uptick in Sell Ratings during Q3
Of the 11,178 ratings on S&P 500 companies at the end of the third quarter (September 30), 48.6% were Buy ratings, 45.1% were Hold ratings, and 6.3% were Sell ratings. During the third quarter, the overall number of ratings decreased by 0.6% (to 11,178 from 11,244).
The number of Buy ratings declined by 2.6% (to 5,434 from 5,580) compared to Q2. Three sectors saw an increase in Buy ratings, led by the Consumer Staples (+2%) and Energy (+2%) sectors. Eight sectors witnessed a decrease in Buy ratings, led by the Telecom Services (-17%) sector.
At the company level in terms of Buy ratings, Symantec (+7), Johnson Controls (+6), and Cabot Oil & Gas (+6) recorded the largest increases in the number of Buy ratings during the quarter, while Dollar General (-10) witnessed the largest decrease in the number of Buy ratings over this time frame.
The number of Hold ratings increased by 1.0% (to 5,034 from 4,896) relative to Q2. Five sectors witnessed a rise in the number of Hold ratings, led by the Materials (+8%) sector. Six sectors witnessed a drop in the number of Hold ratings, led by the Consumer Staples (-3%) sector.
At the company level in terms of Hold ratings, Dollar General (+8), Fortive (+7), and Phillips 66 (+6) recorded the largest increases in the number of Hold ratings during the quarter, while Coach (-7) and St. Jude Medical (-5) saw the largest decreases in the number of Hold ratings over this time frame.
Sell Ratings Up 4.1%
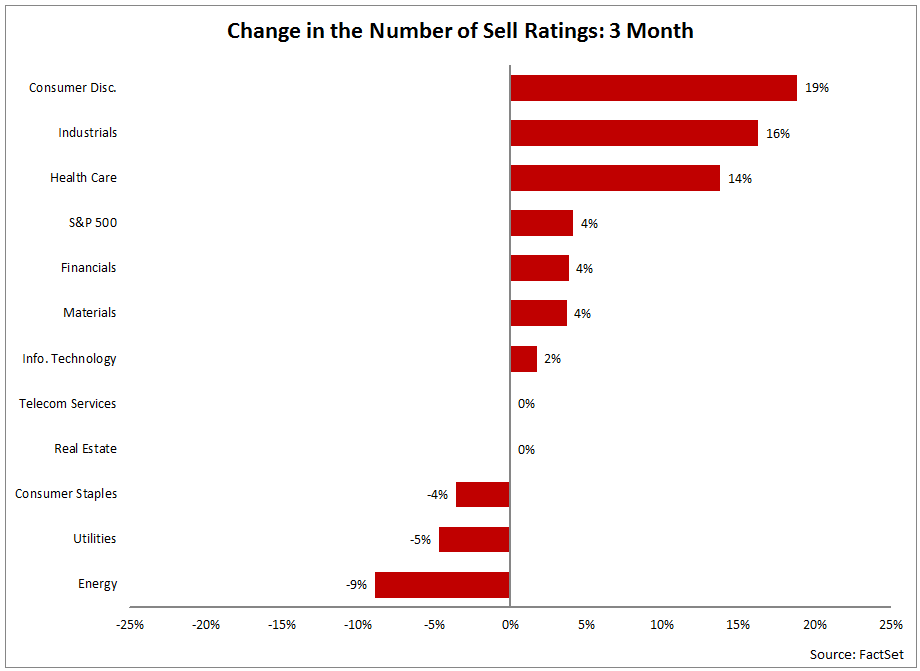
The number of Sell ratings increased by 4.1% (to 706 from 678) relative to Q2. Six sectors witnessed a rise in the number of Sell ratings, led by the Consumer Discretionary (+19%), Industrials (+16%), and Health Care (+14%) sectors. Two sectors (Real Estate and Telecom Services) recorded no change in the number of Sell ratings over this period. Three sectors witnessed a drop in the number of Sell ratings, led by the Energy (-9%) sector.

At the company level in terms of Sell ratings, Unum Group (+3), Harley Davidson (+3), and Equity Residential (+3) saw the largest increases in the number of Sell ratings during the quarter, while Linear Technology (-5), NetApp (-5), and Transocean (-5) saw the largest decreases in the number of Sell ratings during this time.
Analysts Most Optimistic on Health Care, Least Optimistic on Energy
Overall, analysts are most optimistic on the Health Care sector, based on the percentage of Buy ratings at the end of September. The Health Care sector had the highest percentage of Buy ratings (55%) of all eleven sectors at the end of Q3. Over the past 12 months, the average percentage of Buy ratings for the Health Care sector has been 59%, which is the highest of all 11 sectors. On the other hand, the Utilities sector continued to have the lowest percentage of Buy ratings (33%) of any sector. Over the last 12 months, the average percentage of Buy ratings for the Utilities sector has been 36%, which is the lowest average of all 10 sectors.
Analysts are most pessimistic about the Energy sector, based on the percentage of Sell ratings at the end of September. The Energy sector had highest percentage of Sell ratings (9%) of all eleven sectors at the end of Q3. The average percentage of Sell ratings for the Energy sector has been 9% over the past 12 months, which is the highest average of all 11 sectors. On the other hand, the Health Care sector had the lowest percentage of Sell ratings (3%). Over the last 12 months, the average percentage of Sell ratings for the Health Care sector has been 2%, which is the lowest average of all ten sectors.


Insight/Author%20Bios/JohnButters2.jpg)
