

While it’s not easy to uncover a successful strategy for equity outperformance, the process is straightforward: test the attributes of a company or market and measure the impact on future equity performance of that company. There is a clear process and test statistic – for instance, using FactSet’s Alpha Testing application with total return.
Like most things involving fixed income, however, this same process is more complicated and the test statistic is ambiguous. To start, the return of a corporate bond is determined by the passage of time, changes in interest rates, or changes in the spread of the bond. Focusing solely on spread returns is problematic. As argued elsewhere1, a significant portion of the spread of a bond is determined by attributes of the bond that have nothing to do with the attributes of the company. The second problem with spread returns is that they are amplified or muted by duration. A large spread return could be due to a large duration and small spread change or a small duration and large spread change. Finally, since there is a term structure of credit, a valuable test statistic should be independent, or at least consistent, across maturity. What is needed is an observable statistic that reflects just the credit aspects of the bond that is consistent across issuers and maturities. This article will suggest a process and test statistic for developing a credit strategy for fixed income that addresses these issues.
Credit default swaps (CDS) are the test statistic. By design, they reflect the market’s assessment of the likelihood of default of the issuer. Moreover, that is all they measure. CDS are tied more closely to a particular company than they are to a particular bond. This connection allows for testing equity attributes versus CDS. CDS are quoted similar to a price, so a total return can be derived. Finally, while CDS come in a variety of tenors, the five-year tenor is typically the most liquid across issuers, and thus a consistent maturity benchmark.
Here, we employ several FactSet tools to use credit default swaps as a test statistic to develop an alpha strategy for corporate bonds. Our focus, unlike other pieces, is to emphasize the process and not the strategy itself. We will demonstrate the creation of a credit strategy based on equity attributes and CDS returns as the test statistic, and then show how a portfolio with a tilt toward that credit strategy will outperform solely due to spread return.
We start by using Alpha Testing, FactSet’s platform for factor research, to derive an equity-level, multi-factor score as an average of Altman’s Zscore and Doruk Ilgaz’s Rating Propensity Indicator2. The forward price return was based on the bond equivalent price of the five-year CDS3. The goal will be to analyze whether the multi-factor score predicts attractive moves in companies’ CDS prices.
Testing over three years quarterly, we find evidence that the multi-factor equity score predicts attractive moves in the CDS price. The return difference between the top and bottom equity-based fractiles was 24bp4 on average for each quarter over the entirety of the backtest.
In particular, for the period of March 31 through June 30, 2015, the return difference between the top and bottom fractiles was particularly strong at 102bp. To be clear, we’re skipping over the most difficult part, which is defining a credit strategy that is robust and consistent over time. Alpha Testing lets us conduct the required research to determine attractive equity-level characteristics within different corners of the investable market and under various economic regimes. In this example, we will simply demonstrate that the strong, single-period outperformance of our equity-level, multi-factor score can flow through to a bond portfolio constructed to tilt towards the issuers who score well. Further, we will find that the bond portfolio’s outperformance is attributed to spread effects by neutralizing the exposure to other sources of bond return.
Let’s decompose the performance of the Merrill Lynch Industrial 1-10 year index. Using FactSet’s Fixed Income Portfolio Analysis, we can see the index lost 94bps in total return over the quarter. Of particular interest, 38bps of negative return can be attributed to spread effects5.
|
|
Passage of Time(%) |
Changes in Rates(%) |
Changes in Spreads(%) |
Coupon Return (%) |
Total Return (%) |
|
Index |
-0.08 |
-1.37 |
-0.38 |
0.90 |
-0.94 |
Now let’s construct a bond portfolio to take advantage of the multi-factor, company-level score. Using Axioma’s Fixed Income Portfolio Optimization in FactSet, we will optimize a portfolio with the following attributes:
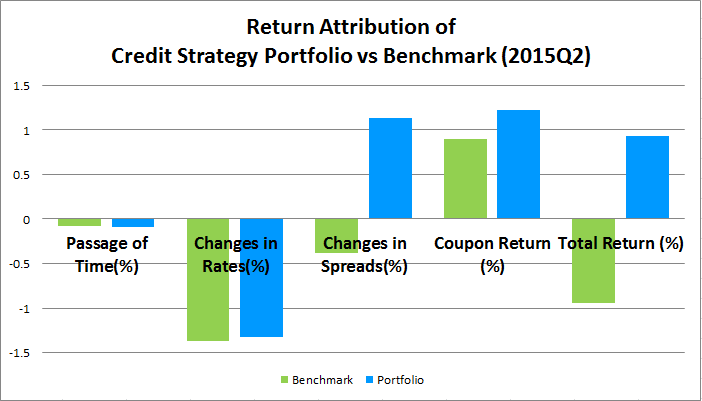
Using this optimal portfolio, we can confirm through return attribution the effectiveness of the tilt while controlling for the other sources of return. The portfolio’s total return of 93bps corresponds to an active return of 187bps. Of particular interest, the portfolio was able to achieve 113bps of return (or 151bps of outperformance) due to spread effects alone – a direct confirmation of our multi-factor, company-level stock score.
|
|
Passage of Time(%) |
Changes in Rates(%) |
Changes in Spreads(%) |
Coupon Return (%) |
Total Return (%) |
|
Benchmark |
-0.08 |
-1.37 |
-0.38 |
0.90 |
-0.94 |
|
Portfolio |
-0.09 |
-1.33 |
1.13 |
1.22 |
0.93 |
|
Outperformance |
-0.01 |
0.04 |
1.51 |
0.32 |
1.87 |
In summary, these results suggest a path toward credit spread testing, using market securities that focus solely on spread and portfolio construction tools to isolate and measure the effectiveness of the test.
[2] Edward Altman, Predicting Financial Distress of Companies: Revisiting the Z-Score and Zeta Models and Doruk Ilgaz , 2013, What Really Affects a Firm’s Credit Rating? Chapter 2, Doctoral dissertation, Economics Department, University of Houston.
[3] Specifically: (CMA_SPREAD_PERCENT_OF_PAR(#F,5,SNR,MID)/CMA_SPREAD_PERCENT_OF_PAR(0,5,SNR,MID)-1)*100
Insight/Author%20Bios/Bill%20McCoy%20Insight.jpg)
Mr. Bill McCoy is Vice President, Senior Director for Fixed Income and Analytics at FactSet. In this role, he actively works in research, client support, and sales to help the firm enhance its position as a leading provider for comprehensive analytics for fixed income securities and the derivatives used to hedge them. Prior to FactSet, he worked for other fixed income software vendors as well as in fixed income portfolio management. He has written and spoken extensively on fixed income hedging and return attribution. Mr. McCoy has earned a master’s degree in Operations Research from the University of North Carolina and is a Chartered Financial Analyst and Professional Risk Manager.

U.S. Mergers & Acquisitions Monthly Review: June 2026
U.S. Mergers & Acquisitions Monthly Review. Gain deep insights into market trends and expert analysis to inform your business...
What 2Q Bank Investment Gains May Signal for Insurance Results
Stay ahead with FactSet’s weekly insights on the latest insurance industry updates, trends, events, and market developments.
Metals & Mining: Copper Capex Watch
FactSet metals and mining analysis: With copper pushed into fresh record territory, explore a capex intensity framework for...
Insurance: Macro Trends and Business Mix Expected to Shape 2Q Earnings Results
Stay ahead with FactSet’s weekly insights on the latest insurance industry updates, trends, events, and market developments.
The information contained in this article is not investment advice. FactSet does not endorse or recommend any investments and assumes no liability for any consequence relating directly or indirectly to any action or inaction taken based on the information contained in this article.
