

The summer of 2015 set the stage for a tumultuous second half for the global bond market, as the continuation of declining oil prices, unusual volatility in the Chinese equity markets, and the dire situation in Greece gradually put pressure on credit spreads. It was likely the intentional devaluation of the Chinese yuan that August (on the heels of steady stream of very weak economic data out of China), was the tipping point that started the downward spiral in the bond market that lasted until February of 2016.
Much of the distress in the global bond markets during January 2016 was tempered by the rally in government bonds, so most bond sectors were positive versus the sharp sell-off in equities. However, very low commodity prices created renewed credit concerns that resulted in the Markit iBoxx $ Basic Materials Index ending 2015 at -8.0% and the Markit iBoxx $ Oil & Gas Index at -5.3%, with January 2016 starting off particularly weak for the sectors at -1.9% and -2.6%, respectively, versus Markit iBoxx $ Investment Grade Index +0.2%.
In addition to improvements in credit perception, last year’s corporate bond market ended the year with much higher benchmark rates and the U.S. dollar strengthened significantly, all of which must be taken into account when comparing performance across issues.
To that end, we compared the performance of 487 USD and 215 EUR denominated senior corporate bonds that were constituents in the Markit iBoxx family of indices across all the major sectors. The universe includes exclusively senior bonds maturing in 2021 to normalize the impact of rates on the pool, and bonds that had a Markit Liquidity Score of 1 through 3 (1 is most liquid and 5 is least liquid) as of the start of 2016 to limit the population to bonds that are traded or quoted frequently.
The data indicates that the bottoming out of the fixed income markets from a credit perspective took place in two waves during the beginning of 2016. As shown in the charts below, January and February had the most bonds report the lowest price of the year, followed by December. The price action at the beginning of the year was largely driven by very pessimistic credit markets, while December’s was mostly driven by the sharp rise in rates after the U.S. presidential elections.
While not shown here, the majority of every euro-denominated bond sector bottomed out in January. However, the data indicates that the majority of dollar-denominated energy, financials, healthcare, and industrials did not have their lowest prices in January. The low point for USD energy and industrial company bonds occurred in February, shortly after crude oil prices bottomed out in mid-January. Financials and healthcare had their worst month in December, which was largely driven by rates for both sectors. The healthcare sector had additional negative tailwinds towards the latter portion of 2016, driven by political uncertainty around the Affordable Care Act under the new administration and negative headlines around pharmaceutical pricing policies.

The reversal of commodity prices resulted in significant price appreciation across a large portion of bonds in the basic material and energy sectors, as evidenced by the pair of charts below. Energy and basic materials bonds were among the best performers across both currencies, with 31% of dollar-denominated basic material and 18% of energy issues reporting 25% or higher returns during the year. The best performer across both currencies was the AK Steel Corp 7.625% 10/2021 issue that increased 177% from a low price of 29.82 on January 20, 2016 to end the year at a 104.25 price. Unlike the AK Steel issue, which is 2.2% lower in price this year, the best performing euro-denominated issue last year was the Norske Skog Hldg AS 8% 2/2021 which is 7.3% higher in price this year after ending last year 71% higher in price.
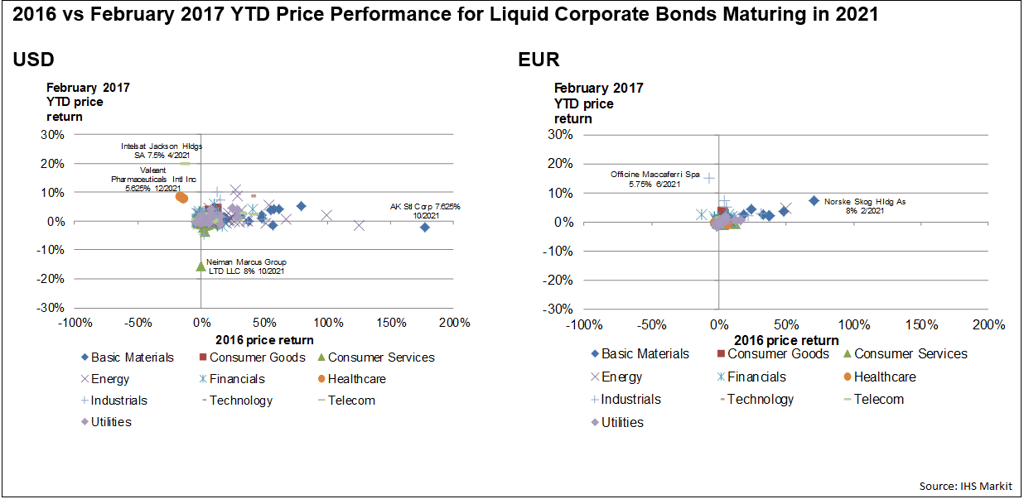
The data indicates that prices are higher on average across the two currencies, with dollar +0.7% and euro denominated +0.4% so far. However, prices for the nine EUR bonds that ended 2016 more than 20% higher are +3.5% this year, while the 45 USD bonds in that segment are only +2.1% this year. The dollar-denominated Intelsat Jackson Hldgs SA 7.5% 4/2021 at +20.0% YTD and Valeant Pharmaceuticals Intl Inc. 5.625% 12/2021 at +8.4% YTD are among the best performers this year after ending last year at -12.3% and -15.7%, respectively. The EUR construction engineering company issue Officine Maccaferri Spa 5.75% 6/2021 is the best performer this year, increasing 15.0% YTD to a 97.48 price after ending 2016 -7.3%.
The rally in distressed securities is most evident when comparing the February 2017 month end prices to the lows of 2016. There were 28 USD issues with 2016 price lows of less than 60.00 and only two EUR basic materials issues Norske Skog Hldg AS 8% 2/2021 and Anglo Amern Cap PLC 2.5% 4/2021, which reached lows of 23.00 and 58.21, respectively. Of the USD bonds, 13 of the 28 were energy issues, six were basic material, the two financials were both issued by Genworth, Sprint Corp 7.25% 9/2021 was the only telecom, and the two utility issues were Talen Energy Supply LLC 4.6% 12/2021 and Baytex Energy Corp 5.125% 6/2021.
The Amern Energy Permian Basin Llc 7.375% 11/2021 was the best performer versus its 2016 low, increasing 415% from its low price of 20.00 on February 15, 2016 to its February 28 price of 83.00. The one issue that stood out the most was the retail Neiman Marcus Group LTD LLC 8% 10/2021, which is both the worst performer in 2017 so far and the only distressed bond in the sample universe that is currently trading lower than its worst level of 2016.

The distress in the bond market during the early part of 2016 presented an abundance of profitable credit investment opportunities in the downtrodden basic materials and energy sectors. Rising rates and expectations of higher rates will weigh on the bond market this year, so the breadth and magnitude of any credit rally will likely be dwarfed in comparison to 2016. However, high yield spreads have tightened rapidly since the selloff in rates late last year, and there is still likely to be greater price return for today’s distressed credits versus investment grade if the current expectations of strong growth become a reality over the next few years. Given the run up in prices for the highest yielding credits over the past year, accurate bond price time series will become critically necessary to identify opportunities in an ocean of global corporate credit alongside good credit analysis and fundamental research.


Chris joined Markit in 2011 and has held several management roles within the firm evaluated pricing business including head of Agency MBS and Consumer ABS, and co-head of Non-Agency RMBS. Prior to Markit, Chris was a Senior Vice President at Halcyon Asset Management.

U.S. Mergers & Acquisitions Monthly Review: June 2026
U.S. Mergers & Acquisitions Monthly Review. Gain deep insights into market trends and expert analysis to inform your business...
What 2Q Bank Investment Gains May Signal for Insurance Results
Stay ahead with FactSet’s weekly insights on the latest insurance industry updates, trends, events, and market developments.
Metals & Mining: Copper Capex Watch
FactSet metals and mining analysis: With copper pushed into fresh record territory, explore a capex intensity framework for...
Insurance: Macro Trends and Business Mix Expected to Shape 2Q Earnings Results
Stay ahead with FactSet’s weekly insights on the latest insurance industry updates, trends, events, and market developments.
The information contained in this article is not investment advice. FactSet does not endorse or recommend any investments and assumes no liability for any consequence relating directly or indirectly to any action or inaction taken based on the information contained in this article.
