Exclusionary investing began as an “anti-something” strategy, while ESG investing seeks to employ these factors into security selection and portfolio construction, offering a “we stand for something” perspective. Nowadays, corporate social responsibility (CSR) is ESG in effect and the number of ways to slice and dice portfolios based on these non-financial considerations can be lumped into “Sustainable Investing” (SI). However, the surviving factors associated with SI are those with the ESG acronym, promoted by the UN Principles for Responsible Investing (http://www.unpri.org/) (UN PRI) first formalized in 2006.
These six basic principles linked SI with fiduciary underpinnings, and the growth of firms pledging to uphold these views is proving to be a global force, nearing 1,200+ recent signatories. Increasing regulations since the Credit Crisis of 2008 are adopting language marrying that of the UN PRI and in some countries, increasingly mandating its usage. This in turn is ushering an era of increasing self-reporting by many companies of their ESG non-financial information, if for no other reason than lowering their reputational risk, with concomitant regulation supporting this trend.
Though the majority of funds invested in specific SI mandates are institutional to date, there is growing interest from retail investors. The total dollars in SI mandates approaches $4 trillion in the U.S. and is estimated to be near $34 trillion in AUM currently worldwide. Originally, SI investing was equity focused, but is now moving into other asset classes; fixed income foremost.
Probably the most common driver into SI mandates comes from shared views of what good corporate citizenship and environmental stewardship is about. Moreover, whether true or perceived, the short term behavior that led to the Global Credit Crisis of 2008 has also expedited sustainability investing to the forefront. This has brought more attention to factors that may drive long term behaviors in corporate boardrooms across the world. This would lead to sustainability being perceived not only an idea but reducing it to practice, allowing reproducibility and consistency of applications in the investing process.
There have been many academic studies on the performance of SI mandates and a few takeaways have proven reliable, these are:
- Companies with high ratings for ESG have lower costs of capital and lower risk of default
- When you itemize the various ways of measuring and ranking environmental, societal and governance returns to investors, the strongest single measure aligns with good corporate governance
This result shouldn’t be surprising, but what these studies predominately focus on is performance. Conventional risk attributes of highly rated ESG companies hasn’t been detailed or reviewed as much other than companies with lower costs of capital. They are by definition deemed to have lower risk but in a fundamental way, not in the lexicon of risk managers who are accounting for risk through lower variance, smaller VaR, or leading to fewer drawdowns and stronger risk adjusted returns. That being said, there are good reasons to believe ESG factors should represent true risk measures. In their daily business activities, companies that generate substantial negative environmental and social contributions or demonstrate poor governance should bear costs that increasingly market participants will not want to participate in, leading to higher risk premium. Moreover, they may be more vulnerable to extreme events if they aren’t managing these risks very well. Consider the firm with a lot of litigation, mine collapses, manufacturing accidents, and community complaints along with many SEC violations. What return would you require to invest in it?
This discussion might lead one to compare ESG indexes with the counterparts they’re based off of (base), calculating the contributions to total risk (systemic and specific) along with 99% one-month VaR seeking what differences one might find. We choose three MSCI ESG indexes for Europe, USA and EAFE (http://www.msci.com/products/indices/esg/ ). From the MSCI website, the performance of the ESG funds with their base are almost identical. Likewise, the tracking error (TE) is quite small, indicating their total risks are probably similar.
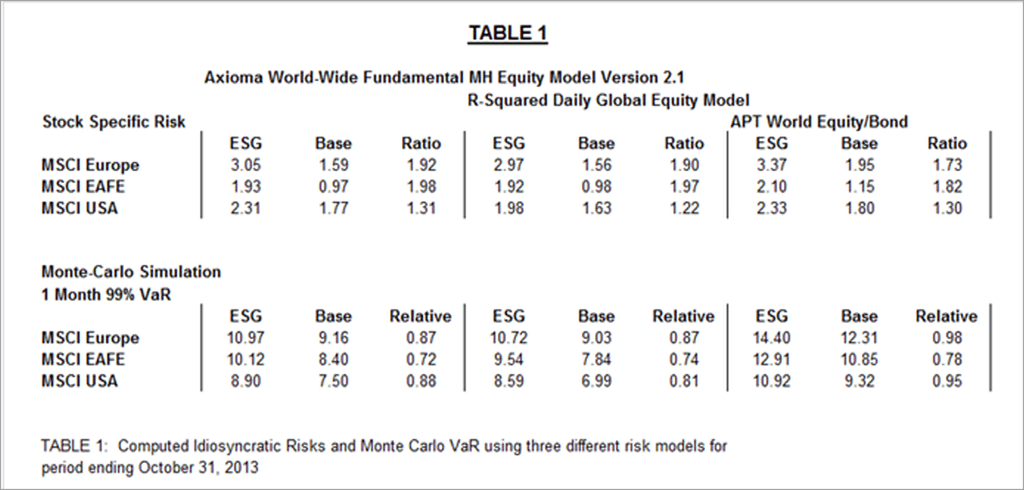
To perform the risk calculation, we treat each ESG index as a portfolio and use the base indexes as their benchmarks to calculate the risk measures as of October 31st, 2013. To make the calculation easy, we choose three global risk models from Axioma, R-Squared and SUNGARD APT.

We report the stock specific risks (as percentage of total risk) and the VaR results as the total risks are almost identical. Examining the specific risks, we see that the ESG values are almost twice the base values for Europe and EAFE and about 20% to 30% higher for the U.S. This informs us that some amount of risk is unexplained by conventional risk model factors as the systematic risk factors must be smaller for ESG than for the base to maintain the same total risk.
The lower part of the chart depicts 99% Value-at-Risk estimates to demonstrate the loss potential in the tails. Notice the ESG portfolios have ~20% higher VaR then their base and the relative VaR is ~70 to 100 bps. This implies though that although the TE is quite small, the risk of the ESG portfolios is hidden in their wider tails.
These risk calculations offer a hint that though fundamental risks may be lower due to ESG ratings, portfolios of these assets leave some standard risk measures inexplicably higher. To successfully manage active portfolios under SI mandates one requires more than simple ESG scores, but a comprehensive risk system to ascertain just what some of the hidden risks of SI investing might be.
Eurosif: "European SRI Study" 2012
Commonfund INSTITUTE: “From SRI to ESG: The Changing World of Responsible Investing” September 2013
Deutsche Bank Group; DB Climate Change Advisors: “Sustainable Investing – Establishing Long-Term Value and Performance”, June 2012
MERCER US-SIF Foundation; “Opportunities for Sustainable and Responsible Investing in US Defined Contributions Plans” September 2011
Data from MSCI (http://www.msci.com/products/indices/esg/)
Risk models from Axioma (http://axioma.com), R-Squared Risk Management (http://www.rsquaredriskmanagement.com/), SUNGARD-APT (http://financialsystems.sungard.com/solutions/risk-management-analytics/investment-risk/APT)
All calculations performed in FactSet.
