

Financial anomalies and regularities in returns have been studied for over 80 years in the U.S. If these patterns are both persistent and observable, investors should incorporate this information into their decision-making, financial plans, and portfolio construction. The question must be asked if traditional investment research is relevant and whether financial anomalies persist. If one started a career on Wall Street or became a financial planner during the period 1987 - 1991, one could have known an extensive and growing body of knowledge on historic and forecasted earnings per share modeling and ostensibly utilized this knowledge thereafter. The reported excess returns of the 1980s continued to be recognized and tested through the 1990s and were apparent in returns after the period.
We report that measures related to historic earnings are highly statistically significantly associated with stock returns both prior to the time when they were first published in the academic literature and after. Earnings forecasting data in particular have been consistent and highly statistically significant sources of excess returns. Specifically, we test a set of U.S. and global variables over the past 16 years and find that many of these fundamental, earnings forecasts, revisions, and breadth variables have maintained their importance for returns. Moreover, earnings forecasting model excess returns are greater in Non-U.S. and Global markets than in the U.S. markets in their post-publication time period, including booms, recessions, and highly volatile market conditions. Overall, we find that quantitative-based models, built on anomalies known at the time, have outperformed indexes in over 70% of the years. Whether these return patterns reflect reward for bearing risk or whether they are reliable sources of true alpha, they have persisted out of sample and, as such, are necessarily important for investors of all varieties.
What did we know in the 1987-1991 time period? Traditional fundamental variables, such as earnings-to-price, book value-to-price, cash flow-to-price, sales-to-price, cash flow-to-price, small size, institutional holdings, earnings forecasts, revisions, recommendations and breadth, earnings surprises, insider trading, dividend yield, and momentum were variables identified in Dimson (1988), Jacobs and Levy (1988), and Levy (1999) as anomalies. Many of these variables were tested and reported in Fama and French (1992), Ziemba and Schwartz (1992), Bloch, Guerard, Markowitz, Too and Xu (1993), and Lakonishok, Shleifer, and Vishny (1994). Many of the earlier reported non-U.S. anomalies and /or compared U.S. and non-U.S. anomalies. Investment texts at the time Graham, Dodd, and Cottle (1962), Malkiel (1973), Latane, Tuttle, and Jones (1975), and Elton and Gruber (1980) all reported these anomalies.
Bloch et al. (1993) used relative ratios as well as current ratio values in analyzing eight factors to understand the relative explanatory power of each in an equation to estimate the determinants of total stock returns, TR. Furthermore, given concerns about both outlier distortion and multicollinearity, Bloch et al. (1993) tested the relative explanatory and predictive merits of alternative regression estimation procedures. They reported several results: 1) The robust regression-constructed composite model portfolio produced higher Sharpe ratios and geometric means than the OLS-constructed composite model portfolio; (2) Survivor bias was not statistically significant; and (3) Tighter turnover and rebalancing triggers led to higher portfolio returns for value-based strategies. They referred to this model as WLRR, for its weighted (W) regression and latent root regression (LRR) approach to multicollinearity.
TR = w0 + w1EP + w2BP + w3CP + w4SP + w5REP + w6RBP + w7RCP + w8RSP + et (1)
Where:
EP = [earnings per share]/[price per share] = earnings-price ratio;
BP = [book value per share]/[price per share] = book-price ratio;
CP = [cash flow per share]/[price per share] = cash flow-price ratio;
SP = [net sales per share]/[price per share] = sales-price ratio;
REP = [current EP ratio]/[average EP ratio over the past five years];
RBP = [current BP ratio]/[average BP ratio over the past five years];
RCP = [current CP ratio]/[average CP ratio over the past five years]; and
RSP = [current SP ratio]/[average SP ratio over the past five years];
Bloch et al. (1993) used relative ratios as well as current ratio values in analyzing eight factors to understand the relative explanatory power of each in an equation to estimate the determinants of total stock returns, TR.
Bruce and Epstein (1994) provide an excellent collection of key studies of the effectiveness of corporate earnings forecasting variables. There is an extensive body of literature on the impact of individual value ratios and variables on the cross-section of stock returns in the pre-2002 time period. Levy (1999) summarized the anomalies recognized at the turn of the century. Further, Brown (2000) contains over 500 abstracts of studies using Institutional Broker Estimation Services (I/B/E/S) data. By 1999, it was known that CTEF, a composite model of consensus-based earnings yield forecasts, earnings revisions, and earnings breadth (the agreement among analysts’ revisions) produced highly statistically significantly correlates of stock returns. For example, Guerard and Mark (2003) demonstrate that CTEF, and a nine-factor model of REG8 plus CTEF is also highly (statistically) significantly correlated with subsequent stock returns.
There is an equally extensive body of literature of the impact of price momentum variables on the cross-section of stock returns. Price momentum, or the non-random character of stock market prices, had been studied since Bachelier in 1900. However, influential recent research such as that of Jegadeesh and Titman (1993), Conrad and Kaul (1993), Conrad and Kaul (1998), and Lo et al. (2000) formalizes and extends the technical analysis and price momentum literature. Most importantly for our analysis, Conrad and Kaul (1998) report the mean-reversion of stock returns in the very short run, one week or one month, and the medium-term persistence of momentum to drive stock prices higher in the 3, 6, 9, 12, and 18-month time horizons over the 1926 -1988 and 1926-1989 time periods. Jagadeesh and Titman (1993) construct portfolios based on six-months of positive price momentum, hold the portfolios for six months, and earn excess returns of 12.01% over the 1965-1989 time period. Thus, illustrating that medium-term momentum is an important, and persistent, risk premium. In the very long-run (24 and 36-months) Conrad and Kaul (1998) show that momentum returns become very negative. Lo et al. (2000) find over the 1962 -1996 time period that technical patterns produced incremental returns, particularly for NASDAQ stocks – demonstrating price momentum and technical analysis variables enhanced portfolio returns over the long-run.
Expanding on the work of Fama and French (1998) and Guerard and Mark (2003), Guerard et al. (2012) create a ten-factor stock selection model for the U.S. expected returns that includes price momentum – the USER model. Guerard et al. (2015) and Guerard and Mark (2018) apply a 10-factor model to global stocks, referring to the model as GLER (GLobal Equity Return), or REG10 (See equation 2).
TRt + 1 = a0 + a1EPt + a2 BP t + a3CPt + a4SPt + a5REPt + a6RBPt + a7RCPt
+ a8RSPt + a9CTEFt + a10PMt + et , (2)
Where:
EP = [earnings per share]/[price per share] = earnings-price ratio;
BP = [book value per share]/[price per share] = book-price ratio;
CP = [cash flow per share]/[price per share] = cash flow-price ratio;
SP = [net sales per share]/[price per share] = sales-price ratio;
REP = [current EP ratio]/[average EP ratio over the past five years];
RBP =[current BP ratio]/[average BP ratio over the past five years];
RCP = [current CP ratio]/[average CP ratio over the past five years];
RSP = [current SP ratio]/[average SP ratio over the past five years];
CTEF = consensus earnings-per-share I/B/E/S forecast, revisions and breadth;
PM = price momentum; and
e = randomly distributed error term.
The GLER model produces highly statistically significant active returns and better stock selections than the USER model over the corresponding period. In addition, the earnings forecasting model, CTEF, continues to produce statistically significant Active Returns and Specific Returns (stock selection) during the 1996 -2016 time period.
Markowitz Risk Modeling and Axioma Risk Models: Constructing Mean-Variance Efficient Frontiers
The Markowitz (1952 and 1959) portfolio construction approach seeks to identify the efficient frontier, the point at which returns are maximized for a given level of risk, or risk is minimized for a given level of return. The portfolio expected return, E(Rp), is calculated by taking the sum of the security weights multiplied by their respective expected returns. The portfolio standard deviation is the sum of the weighted covariances. We estimate Efficient Frontiers, maximizing returns or a given level of risk and minimizing risk for a given level of return. One commercially-available risk model and optimization software on the FactSet platform is the Axioma risk model and optimizer. Axioma offers both U.S. and world fundamental and statistical risk models, using weighted least squares (WLS) regression, which scales the asset residual by the square root of the asset market capitalization (to serve as a proxy for the inverse of the residual variance). Robust regressions, using the Huber M Estimator, address the issue and problem of outliers. (Asymptotic) principal components analysis is used to estimate the statistical risk factors. A subset of assets is used to estimate the factors and the exposures and factor returns are applied to other assets.
Axioma has pioneered a technique to address the so-called under-estimation of realized tracking errors, particularly during the 2008 Financial Crisis. The technique, known as the Alpha Alignment Factor, AAF, recognizes the possibility of missing systematic risk factors and makes amends to the greatest extent that is possible without a complete recalibration of the risk model that accounts for the latent systematic risk in alpha factors explicitly. In the process of doing so, AAF approach not only improves the accuracy of risk prediction, but also makes up for the lack of efficiency in the optimal portfolios. The naïve application of the portfolio optimization has the unintended effect of magnifying the sources of misalignment. The optimized portfolio underestimates the unknown systematic risk of the portion of the expected returns that is not aligned with the risk model. Consequently, it overloads the portion of the expected return that is uncorrelated with the risk factors. The empirical results in a test-bed of real-life active portfolios based on client data show clearly that the above-mentioned unknown systematic risk is a significant portion of the overall systematic risk and should be addressed accordingly. Saxena and Stubbs (2012) report that the earning-to-price (E/P) and book-to-price (B/P) ratios used in USER Model and Axioma Risk Model have average misalignment coefficients of 72% and 68%, respectively. While expected-return and risk models are indispensable components of any active strategy, there is also a third component, namely the set of constraints that is used to build a portfolio. Saxena and Stubbs (2012) propose that the risk variance-covariance matrix,C, be augmented with additional auxiliary factors in order to complete the risk model. The augmented risk model has the form of:
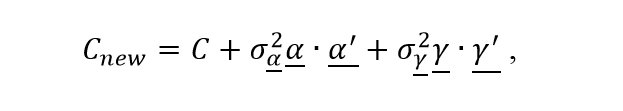
where ![]() is the alpha alignment factor (AAF),
is the alpha alignment factor (AAF), ![]() is the estimated systematic risk of
is the estimated systematic risk of ![]() ,
, ![]() is the auxiliary factor for constrains, and
is the auxiliary factor for constrains, and ![]() is the estimated systematic risk of
is the estimated systematic risk of ![]() . The alpha alignment factor is the unitized portion of the uncorrelated expected-return model, i.e., the orthogonal component, with risk model factors. Saxena and Stubbs (2012) report that the AAF process pushed out the traditional risk model-estimated efficient frontier. Saxena and Stubbs (2015) refer to alpha in the augmented regression model as the implied alpha. According to Saxena and Stubbs (2015), the base risk model, BRM, assumes that any factor portfolio uncorrelated with X-common risk factors has only idiosyncratic risk. Z is the exposure matrix associated with systematic risk factors missing from the base risk model, and the risk model fails to account for the systematic risk of portfolios with exposure to the Z factors. Saxena and Stubbs (2015) report that there is a small increment to specific risk compared to its true systematic risk.
. The alpha alignment factor is the unitized portion of the uncorrelated expected-return model, i.e., the orthogonal component, with risk model factors. Saxena and Stubbs (2012) report that the AAF process pushed out the traditional risk model-estimated efficient frontier. Saxena and Stubbs (2015) refer to alpha in the augmented regression model as the implied alpha. According to Saxena and Stubbs (2015), the base risk model, BRM, assumes that any factor portfolio uncorrelated with X-common risk factors has only idiosyncratic risk. Z is the exposure matrix associated with systematic risk factors missing from the base risk model, and the risk model fails to account for the systematic risk of portfolios with exposure to the Z factors. Saxena and Stubbs (2015) report that there is a small increment to specific risk compared to its true systematic risk.
Saxena and Stubbs (2012) showed the predicted and realized active risks for various risk target levels and note the significant downward bias in risk prediction when the AAF methodology is not employed. The realized risk-return frontier demonstrates that not only does using the AAF methodology improve the accuracy of the risk prediction, it also moves the ex-post frontier upwards, thereby giving ex-post performance improvements. In other words, the AAF approach recognizes the possibility of missing systematic risk factors and makes amends to the greatest extent that is possible without a complete recalibration of the risk model that accounts for the latent systematic risk in alpha factors explicitly. In the process of doing so, AAF approach not only improves the accuracy of risk prediction, but also makes up for the lack of efficiency in the optimal portfolios. Saxena and Stubbs (2015) report positive frontier spreads. Guerard, Markowitz, and Xu (2015) test CTEF and a ten-factor regression-based model of global expected returns, GLER, during the 1997- 2011 time period. The authors report that the geometric means and Sharpe ratios increase with the targeted tracking errors; however, the information ratios are higher in the lower tracking error range of 3–6%, with at least 200 stocks, on average, in the optimal portfolios. Guerard and Chettiappan (2017) also report the effectiveness of AAF modeling in an Emerging Markets portfolio. Moreover, the EM portfolio results of Guerard and Chrettiappan presented at the FactSet Investment Symposium in Orlando showed higher Geometric Means, Sharpe ratios, and Information Ratios in the EM markets relative to Non-US and U.S, markets.
The Existence and Persistence of Financial Anomalies: 2003 - 2017
Testing and reporting on financial anomalies, we find that many of the previously identified financial anomalies have continued to produce statistically significant Active and Specific Returns in the post-publication period, 2003 – 2017. In the Non-U.S. and EAFE universes, Guerard and Mark (2018) reported that the CTEF ICs were higher than the REG10 or GLER ICs in their 10, 5, 3, and one-year time sub-periods. The CTEF and REG10 produced approximately 400-500 basis points of Active Returns and about 250 basis points of Specific Returns. The Non-U.S. portfolios offer more stock selection than U.S. portfolios with the addition of the REG8 plus CTEF (denoted REG9) and REG10 factors. The t-statistic on the risk stock selection effect in Non-U.S. portfolios is maximized with ranked CTEF. The t-statistics on the risk stock selection effect is statistically significant for REG10, although the t-statistic on the risk stock selection effect in the Non-U.S. portfolios is only statically significant at the 10 percent level. Guerard and Mark (2018) reported that only ranked CTEF is statistically significant in the U.S. whereas globally, ranked CTEF and REG10 are statistically significant in Total Active Returns and Risk Stock Selection Returns.
Guerard and Mark (2018) reported that the financial anomalies of EP, BP, CP, SP, CTEF, and PM continue to be statistically significant. The CTEF, GLER, and USER optimized portfolios outperform in 70% and 77% of the years, respectively, for 1996-2016 and 2003-2017, using the ITG transactions cost curves. Financial anomalies, as published in 2003 and 2012-3 continue to outperform.
Fama (1991) claimed that anomalies may be correctly identified due to changing risk models and their underlying factor structures. We agree, and address this issue with two approaches. First, the MVM59 optimizations use variance as risk and a full covariance estimation. No factors are involved and changing risk factors are not an issue. Second, the authors use a Boolean signal for stock selection in Guerard et al. (2015). In this test, one buys a stock with a CTEF score that exceeds 85 and sells the stock when the CTEF score falls below 70. Stocks are held in an equally-weighted portfolio. Such a model does not use optimization at all and is a great first-round test of an anomaly. One then uses an Axioma Fundamental Risk Model, version 4, to perform access sock selection. One finds for the CTEF variable that the Boolean signal produces an Active return of 10.33% annualized (t=5.97, highly statistically significant), for the January 2003 – August 2018 time period. Moreover, the CTEF Boolean signal test produced 608 basis points (t =10.24) of Specific Returns. Factor contributions are 308 basis points, led by Medium-term Momentum factor contributions of 148 basis points (t =8.06). The authors recently used the Boolean signal argument to address a footnote in Brennan and Lo (2010) which repeated several Wall Street “researchers” claiming that Markowitz Mean-Variance analysis can produce impossible frontiers. We do not find such results with a reasonably specified upper stock bound and reasonable turnover constraints.
Summary and Conclusions and a Look to the Future
The past thirty years of S&P 500 returns have produced a great performance record; perhaps the best 30-year period in the modern history of the stock market (since-1895 and the founding of the Dow). We report that a stock selection model and an earnings forecasting model produce statistically significant asset selection in U. S. stocks, 1997-2016, and for Non-US stocks during the December 2002 – November 2016 period. We report that Markowitz mean-variance optimization continues to be particularly efficient for producing efficient frontiers. We show how forecasted earnings acceleration produces highly statistically significant stock selection in global and U.S. stock universes. CTEF and REG10 models optimized portfolios produce higher Active and Specific Returns in Non-U.S. stocks, whereas only CTEF works in U.S. CTEF and PM complement the original eight-factor Markowitz Model in Non-U.S. stocks. Have markets and stock selection models changed since Guerard and Mark (2003) and Guerard et al. (2013) published their studies? No, CTEF and REG10 still dominate most other models, including the 36 models tested in Guerard et al. (2018), including the Post-Global Financial Crisis.
The financial anomalies identified in Dimson (1988), Jacobs and Levy (1988), and Levy (1999), exist and have persisted. Moreover, the recent findings of Gillam, Guerard, and Cahan (2015) suggest that earnings transcripts, commonly available to investors and often reported in the news, contain information that offers statistical support for inclusion in the portfolio creation process. Alternative data and predictive analytics, new data sources and modeling techniques, offer the potential for investor risk-adjusted return enhancement. Evidence suggests that about 2 in 20 new databases enhancement the financial anomalies we report. Thus, we see the possibility for about 15-20 percent return enhancement with more sophisticated robust regression, machine learning, and the new databases.
All references in this article can be found in the whitepaper: Earnings Forecasts and Revisions, Price Momentum, and Fundamental Data: Further Explorations of Financial Anomalies


U.S. Mergers & Acquisitions Monthly Review: June 2026
U.S. Mergers & Acquisitions Monthly Review. Gain deep insights into market trends and expert analysis to inform your business...
What 2Q Bank Investment Gains May Signal for Insurance Results
Stay ahead with FactSet’s weekly insights on the latest insurance industry updates, trends, events, and market developments.
Metals & Mining: Copper Capex Watch
FactSet metals and mining analysis: With copper pushed into fresh record territory, explore a capex intensity framework for...
Insurance: Macro Trends and Business Mix Expected to Shape 2Q Earnings Results
Stay ahead with FactSet’s weekly insights on the latest insurance industry updates, trends, events, and market developments.
The information contained in this article is not investment advice. FactSet does not endorse or recommend any investments and assumes no liability for any consequence relating directly or indirectly to any action or inaction taken based on the information contained in this article.

