

Assets based on net operating losses (NOLs) have a value only when they can be used to offset future tax burdens. The value of the NOL-assets has a limited time to utilization, and there is likely a turning point for a company where the short-term value of the NOL-assets is outweighed by the long-term value of business decisions made by management. If the preservation of NOLs deters shareholders from seeking changes to management, then investors should consider management’s long-term plan to turn around the company in addition to the short-term decision of protecting the tax-assets from a change in ownership event.
FactSet SharkRepellent tracks the date for when a company adopts or amends a poison pill as well as the dates of any changes to a company’s charter or bylaws. Using the dates for all NOL-related events, we created a portfolio of NOL-companies that divided the companies into two groups:
For a company that adopted both a poison pill and a charter/bylaw limitation, the company’s placement was based upon which event occurred first.
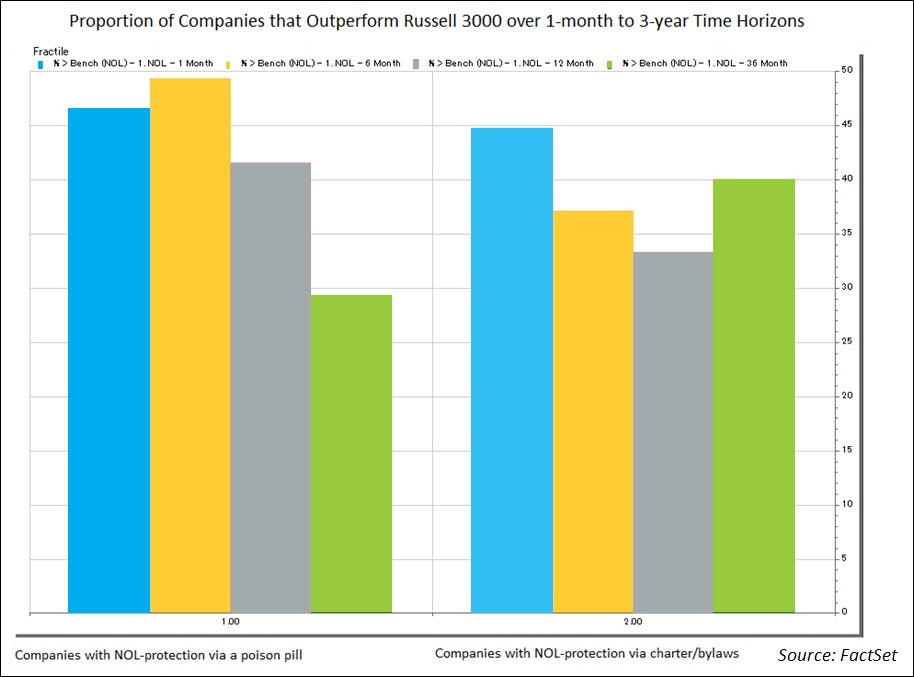
Using FactSet Alpha Testing, we compared the performance of an event-driven portfolio based on the date a company changed its shareholder rights to protect NOLs to the Russell 3000 as a performance benchmark. Alpha Testing compared the performance of the Russell 3000 to the portfolio of companies that adopted the NOL protection within rolling one-month brackets. These portfolios were compared over one-month, six-month, one- year, and three-year time horizons on a binary basis of over or under performance. The binary statistics were then aggregated to create a proportion of over/under performance for each of the time horizons.
In the aggregate, the portfolio of NOL-protected companies that outperformed the Russell 3000 never topped 50% for any of the time horizons, which suggests that companies that experienced sufficient net operating losses to deem it necessary to protect the asset’s value could not utilize those assets to generate improved performance that lead to returns above the index value. The proportions range from 49% for the six-month poison pill portfolio to 29% for the three-year poison pill portfolio. The poison pill portfolio has an uptick from one-month to six-month in the proportion of over performance (45% to 49%), but then has a steady decline at the one-year and three-year time horizons. The charter/bylaw limitation portfolio had short-term decreases (45% to 37% to 33%), but the proportion of companies that outperformed the benchmark had an uptick for the three-year horizon (40%) and had a higher proportion relative to the poison pill portfolio (29%).
Given that NOL protection is most likely to occur after a period of poor financial performance, outperforming the index is a notable accomplishment. However, the trend where the number of instances of outperformance continually declines may suggest that the short-term performance boost from the utilization of the NOL assets is outweighed by management decisions that cannot turn around the company’s performance in the long-term.
For a point of comparison, we ran the same type of model with the event-driven portfolio based on the date of the first activist campaign against all targeted companies. We then divided the companies into subgroups of all companies in the SharkRepellent universe and companies that were the target of an activism campaign after the adoption of NOL protection. For both portfolios, the event date was the first activist campaign against the company.
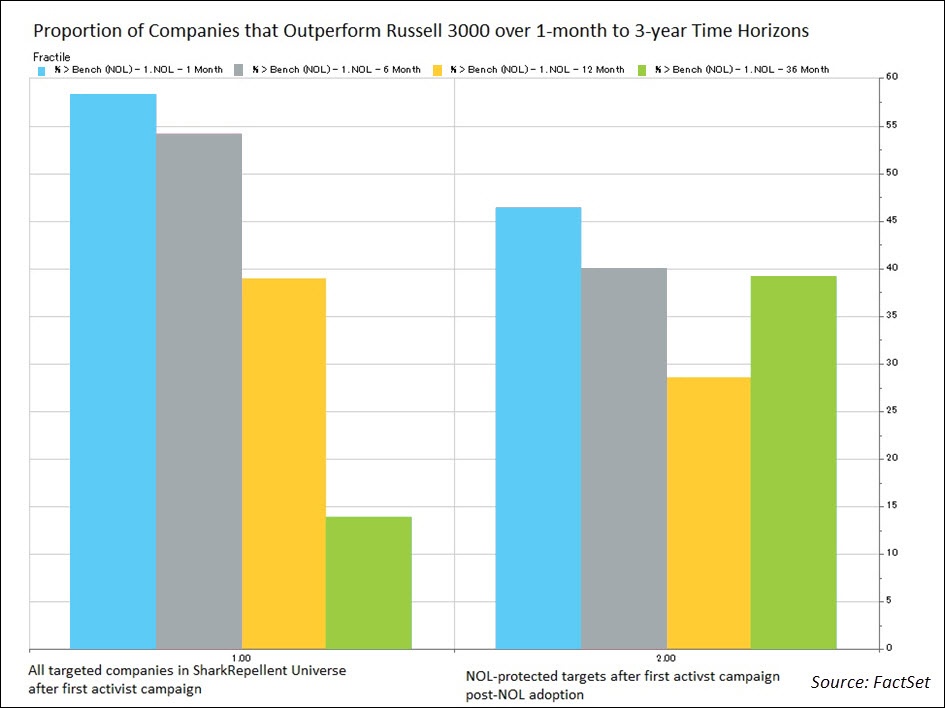
The one-month results suggest that activist campaigns in general are viewed favorably by the market as the portfolio outperforms the index 58% of the time. For the NOL-protection subgroup, the proportion is only 46%, but still higher than the proportion for all NOL-protected companies (45%). The proportion of outperformance for both groups falls steadily over the six-month and one-year time horizons. For the three-year horizon, the NOL-protected portfolio sees an uptick (39%) while the overall activism portfolio continues to fall further (14%). Although more rigorous analysis is necessary to settle the debate on the long-term effects of activism, this simple model suggests that activism triggers short-term value gains but has long-term negative effects on a company’s value.
However, for the subgroup of NOL-protected companies, the companies that were activist targets after adopting NOL protections outperformed the index at a higher rate (39%) over the long-term than the NOL-protected companies that were never an activist target (29%). Whether the activist brought new ideas to management or influenced management to articulate a clear turnaround plan, companies with NOL-assets saw long-term value from activism despite the limitations to changes in ownership.
Also see Poison pills and net operating loss assets: protecting the balance sheet or the board of directors?

U.S. Mergers & Acquisitions Monthly Review: June 2026
U.S. Mergers & Acquisitions Monthly Review. Gain deep insights into market trends and expert analysis to inform your business...
What 2Q Bank Investment Gains May Signal for Insurance Results
Stay ahead with FactSet’s weekly insights on the latest insurance industry updates, trends, events, and market developments.
Metals & Mining: Copper Capex Watch
FactSet metals and mining analysis: With copper pushed into fresh record territory, explore a capex intensity framework for...
Insurance: Macro Trends and Business Mix Expected to Shape 2Q Earnings Results
Stay ahead with FactSet’s weekly insights on the latest insurance industry updates, trends, events, and market developments.
The information contained in this article is not investment advice. FactSet does not endorse or recommend any investments and assumes no liability for any consequence relating directly or indirectly to any action or inaction taken based on the information contained in this article.

