

Axioma’s recently released macroeconomic-based model provides a way to measure and manage financial risk in a U.S. portfolio by considering macroeconomic variables and events, and is now available on FactSet. The model’s horizon is three to six months—what we deem to be “medium” horizon. The Macro model joins four other model variants already offered by Axioma: two fundamental models and two statistical models, each offered for both a medium and a short (one-to-two month) horizon.
Why should you consider using a macro model? The model offers new insights that result from a unique and different view of potential drivers of portfolio volatility and returns. For example, you can:
Axioma’s Macro model produces “unbiased” risk forecasts. In other words, it does not systematically under- or over-predict risk. It is updated daily using a technique that converts economic factors reported monthly or quarterly, with a lag, to daily returns that reflect only “new news.”
The “dynamic factor model” uses many macroeconomic data series to capture a comprehensive view of the impact of economic variables. The model also incorporates market-traded variables and some basic fundamental factors. Below we list the model’s factors, data sources, and how they should be interpreted:
Table 1. Macro Model Components
Category/Factor |
Data |
Interpretation |
Core Macro Factors |
||
| Economic Growth | Industrial production, capacity utilization, Savings rates, retail sales, etc. |
Change in expectation of year-over-year growth in Industrial Productions |
| Inflation | PPI, CPI, PCE deflator, etc. | Change in expectation of year-over-year growth in inflation |
| Confidence | Consumer confidence index, ISM PMI survey, strength in USD | Unexpected changes in consumer confidence |
Market-Traded Macro Factors |
||
| Commodity | S&P GSCI® non-energy spot index | Return |
| Oil | Spot price of West Texas Intermediate crude | Return in excess of the commodity factor return |
| Gold | S&P GSCI® Gold spot index | Return in excess of the commodity factor return |
| Term Spread | Yields of 10-year and 13-week US Treasuries | A positive factor return represents a widening of the spread |
| Credit Spread | BAA- and AAA-rated US corporate bonds | A positive factor return represents a widening of the spread |
| FX basket | Basket of currencies defined by the IMF SDR portfolio | Return in US dollars |
Equity Factors |
||
| Equity Market | Axioma fundamental model market factor | Market return in excess of the economic growth factor return |
| Equity Value | Axioma fundamental model Value factor | Return to a portfolio with unit exposure to Value and no net exposure to other factors |
| Equity Size | Axioma fundamental model Size factor | Return to a portfolio with unit exposure to Size and no net exposure to other factors |
| Sector Factors (10) | Axioma industry returns | Cap-weighted aggregate return of industries in the 10 GICS® sectors in excess of the style and market factors |
It is important to emphasize that the factor exposures are intuitive. For example, a portfolio overweight oil stocks should have a positive exposure to the oil factor (so if oil prices go up, the portfolio benefits). In Table 2, we present the exposures of a number of different ETFs, along with the inter-decile range of exposures that might be expected.
Table 2. Sample ETF Exposures
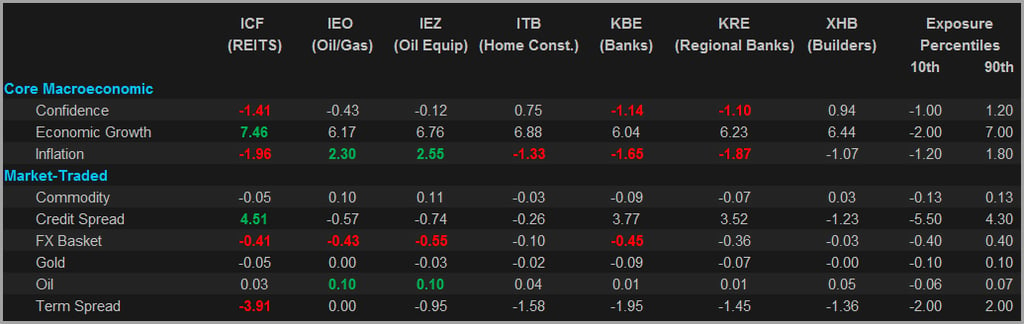
This table illustrates many intuitive exposures. As you can see, Bank ETFs have negative exposures to inflation (they will be hurt if inflation unexpectedly rises), whereas oil-related ETFs have quite positive inflation exposures.
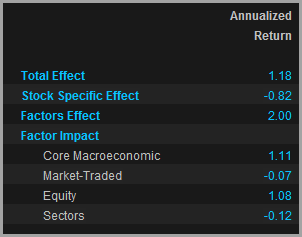
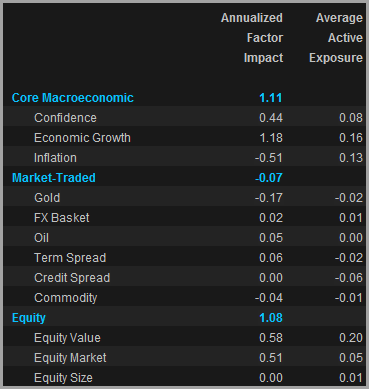
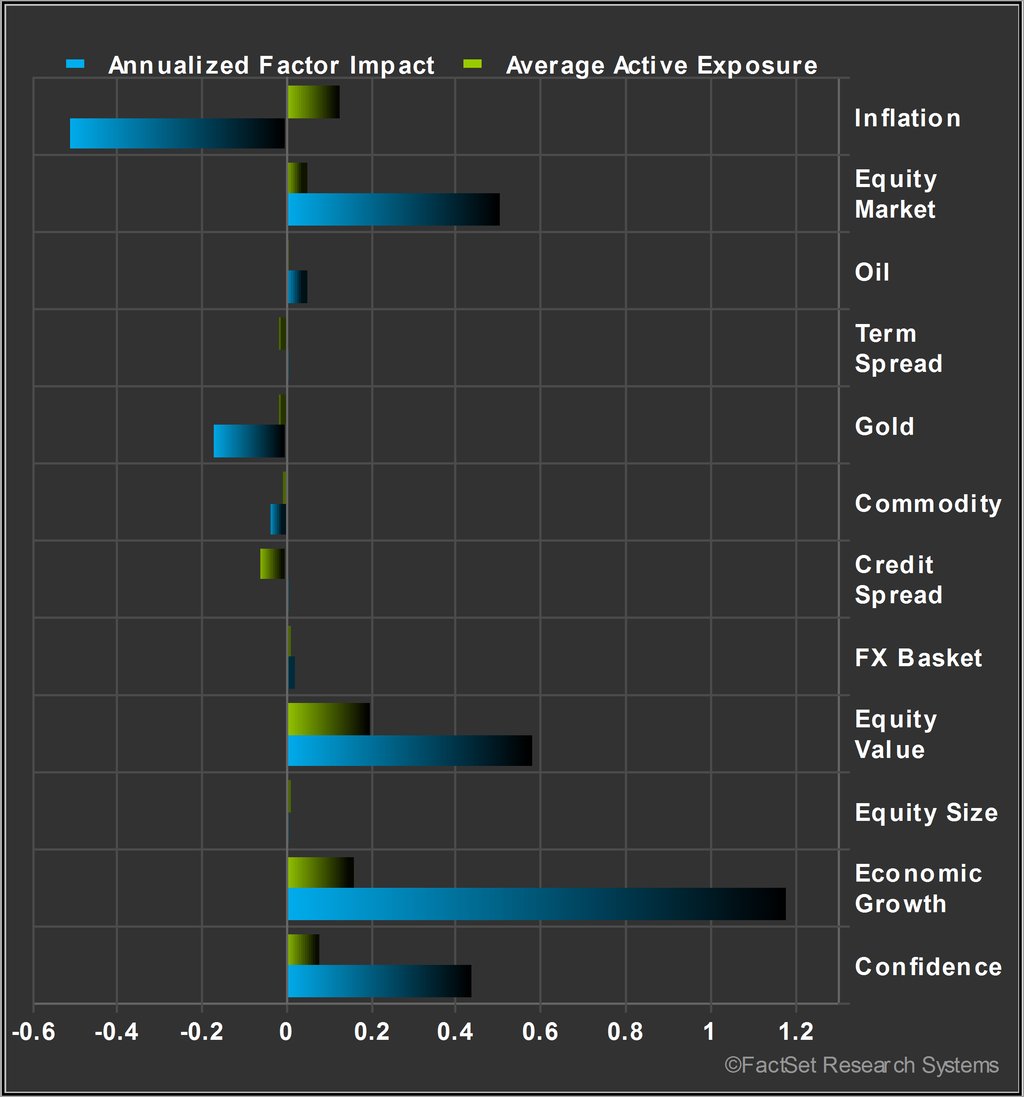
Assessing how macroeconomic factors drive portfolio returns using the macro model for factor attribution is useful. In Table 3, we show attribution results for a sample large-cap core portfolio with a Russell 1000 benchmark. The portfolio beat its benchmark by more than 1% per year from 2009-2013. What drove those active returns? We can see that the portfolio had positive bets on all three core macro factors, as well as on both Equity Market and Equity Value. While most of the bets paid off, a positive exposure to inflation hurt returns. The manager may want to determine if these bets were deliberate and, if not, try to find a way to reduce the exposures.
Table 3. U.S. Macroeconomic Model Factor Attribution, 2009-2013
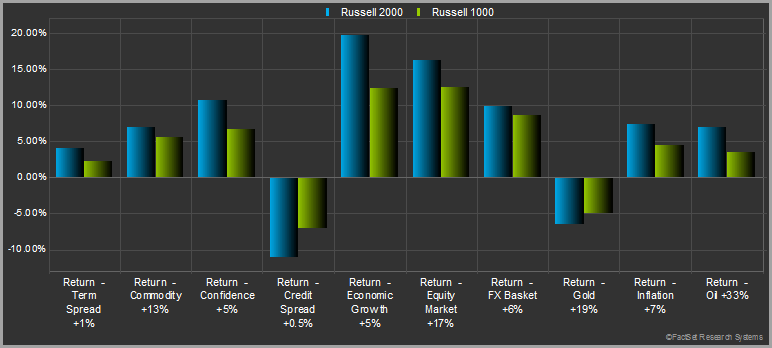
The macro model can also be used to test assumptions about market events to assess the impact on a portfolio’s total or active returns. For example, how would a big shock, such as an increase in credit spreads of 1%, affect portfolio returns? Figure 1 depicts the impact on the total risk estimates of the Russell 1000 and Russell 2000 of various shocks. The same tests could be run on active returns.
Figure 1. Benchmark Impact of Large Factor Moves
The stress-testing capability can also be used to see how a portfolio with current factor exposures would have performed in a specific time period. For example, how might a portfolio with the current factor exposures have fared in September 2008?
To summarize, Axioma’s Macroeconomic model allows you to examine the decomposition of daily risk (or active risk) in a portfolio along macroeconomic lines. Further analysis may include attributing performance to those exposures, stress testing the impact of changes in the returns to those exposures, and determining how the portfolio might react to situations that have occurred in the past. The new Macroeconomic model adds to Axioma’s range of tools that provide a better understanding of the risks associated with your portfolio choices.

Why AI Architecture Is the Key Competitive Variable in Financial Services
In this FactSet article we offer perspective and a strategic framework for firms across the financial sector to consider when...
Fractional Shares, Odd Lots, and the Overhaul of U.S. Market Data: What Data Teams Need to Know
Learn about the significant changes to plan for in 2026 if you work with real-time or historical U.S. equity data, including...
24/5 Trading: What It Is, Why It’s Coming, and What It Means for Your Data Stack
U.S. equity markets are moving toward near-continuous trading. If you work with real-time market data, this FactSet overview of...
Supply Chain Signals: Enhancing the Customer Momentum Strategy with Network Centrality
Explore enhanced customer momentum strategies using supply chain relationships and centrality measures to improve signal quality...
The information contained in this article is not investment advice. FactSet does not endorse or recommend any investments and assumes no liability for any consequence relating directly or indirectly to any action or inaction taken based on the information contained in this article.

