In the seven months since the U.S. presidential election, we have seen the stock market soar to new heights, along with both consumer and business sentiment indicators. Driving this enthusiasm has been optimism regarding the new Trump administration’s promises for pro-growth and pro-business economic policies. Yet this ebullience does not appear to be translating into stronger performance for most measures of the real economy so far in the first half of 2017, and those surveys have retreated somewhat as the equity markets have flattened out and progress on reforms has stalled in Washington D.C.
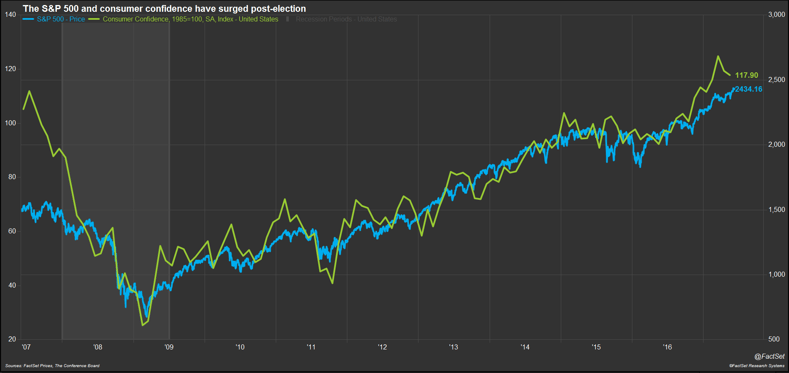
Since the election, the S&P 500 price index is up 13.5% and, at 2,433, is just below its record high (as of market close on June 7). However, most of this growth happened between November and February; since the end of February, the index is up just 2.8%. Business and consumer surveys initially reflected this same optimism, but we have seen small retreats in sentiment measures for both in the second quarter. Note that the sentiment indicators may have pulled back recently, but they still remain elevated and near longer-term highs.
 FactSet clients: launch this chart
Sentiment Indicators
The Institute for Supply Management (ISM) manufacturing purchasing managers index (PMI) rose from 52.0 in October 2016 to a two-and-a-half year high of 57.7 in February 2017; similarly, the non-manufacturing PMI increased from 54.6 right before the election to 57.6 in February. Both measures have come down from those highs in the first two months of the second quarter; the manufacturing PMI now stands at 54.9, while the non-manufacturing index has slipped to 56.9. The readings above 50 still indicate economic expansion, but the perceived strength of the expansion is now marginally lower.
Small business sentiment also saw a significant boost following the November election. The National Federation of Independent Business (NFIB) Small Business Optimism Index rose dramatically post-election, surging to a 14-year high of 105.9 in January 2017. However, the index has since edged back slightly to 104.5 as of April, with progress on federal legislation faltering. As for consumers, the Conference Board’s measure of consumer confidence surged from 100.8 in October 2016 to a post-recession high of 124.9 in March 2017; the index slipped slightly in April and May, with the latest reading coming in at 117.9.
 FactSet clients: launch this chart
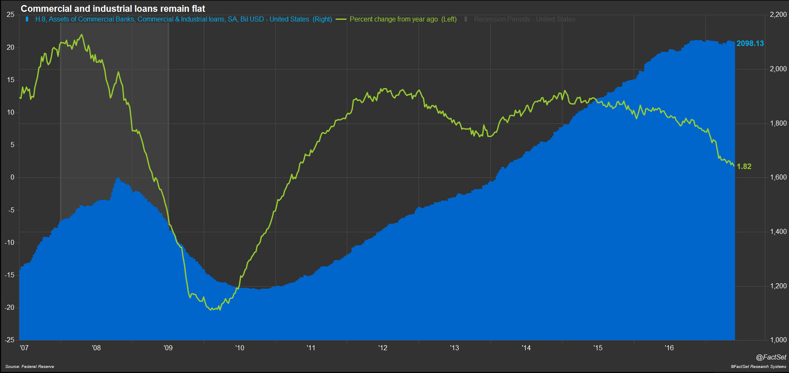
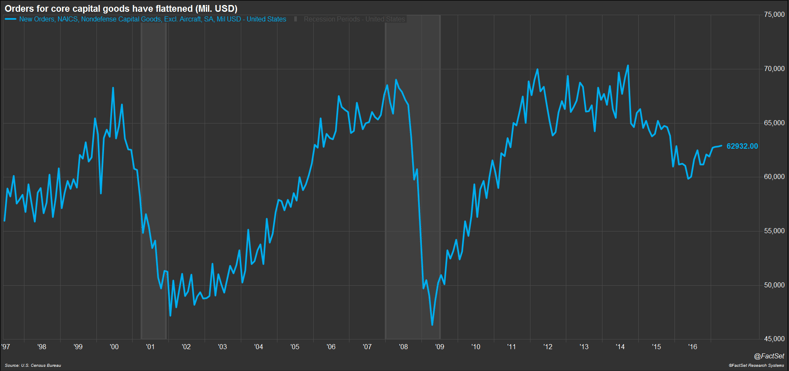
Interestingly, we have not seen increases in short-term economic data indicators commensurate with these peaks in sentiment. The Census Bureau’s monthly data on orders of nondefense capital goods excluding aircraft is often used as a proxy for business spending plans. These core capital goods orders have remained essentially flat for the last three months, although they were up 3.0% from a year earlier in April. In addition, businesses do not appear to be taking on more bank loans at this time, a further sign of reduced activity.
 FactSet clients: launch this chart
Commercial and industrial loans by U.S. commercial banks have remained flat for the last seven months. The 2017 year-to-date zero change in C&I loans compares to a $143 billion increase in 2016; at this pace, loan growth is on pace to show the smallest annual increase since 2010, when total C&I loans fell as the economy was still coming out of recession. The flat loan volume is not only a reflection of slower business activity by potential borrowers; it also points to weakness ahead for the balance sheets of commercial bank lenders.
The Stalling Job Market
Hiring by U.S. employers appears to have stalled as well. The year 2017 started on a strong note, with 216,000 nonfarm payroll jobs added in January and 232,000 in February; but job gains over the last three months have averaged just 162,000. Part of the problem for employers is a lack of qualified applicants in tight labor markets. The May ISM manufacturing survey indicated that a large number of respondents cited difficulty finding skilled labor to fill open positions. The Federal Reserve’s most recent Beige Book, published last week, also cited labor shortages around the country and across a range of occupations. Meanwhile, the Bureau of Labor Statistics’ Job Openings and Labor Turnover Survey (JOLTS) release this week showed job openings at a series high of 6 million in April.
For the consumer, first quarter spending data did not reflect the enthusiasm in the consumer confidence numbers, but early second quarter data does show an improvement. In the first quarter of 2017, real personal consumption expenditures rose just 0.6% on an annualized quarter-over-quarter basis, the slowest quarterly increase since the end of 2009. However, in April both retail sales and consumer expenditures were up 0.4% from the prior month, corresponding to 4.5% and 4.3% year-over-year growth, respectively. On an inflation-adjusted basis, consumer spending rose 0.2% for the month or 2.6% year-over-year. Despite continued weak wage growth, we are seeing an improvement in income growth that appears to be driving the stronger consumption data.
Businesses and consumers alike are watching closely to see what progress Washington D.C., will make in 2017 with respect to legislation on health care, tax reform, and regulatory changes. Signs of progress could help to reinvigorate the rallies in both equity markets and sentiment indicators, but continued delays could have a negative impact on the real economic indicators.
