

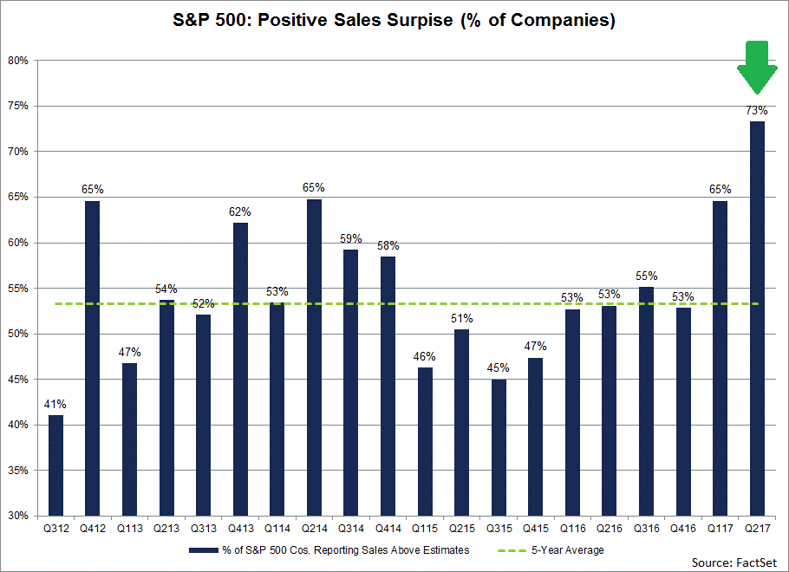
As of Friday, 57% of the companies in the S&P 500 have reported actual earnings and sales numbers for the second quarter. Of these companies, 73% have reported sales above estimates and 27% have reported sales below estimates. How does this 73% number compare to recent averages?
During the past year (four quarters), 56% of the companies in the S&P 500 have reported sales above the mean estimate on average. During the past five years (20 quarters), 53% of companies in the S&P 500 have reported sales above the mean estimate on average. Thus, the percentage of companies reporting sales above estimates to date for Q2 2017 is running well above both the trailing one-year average and the trailing and five-year average.
If 73% is the final percentage for the quarter, it will mark the highest percentage of companies reporting sales above estimates for a quarter since FactSet began tracking the data in Q3 2008. The current record for the highest percentage for a quarter is 72%, set in Q2 2011.
At the sector level, the Telecom Services (100%), Energy (88%), Materials (85%), and Information Technology (84%) sectors have the highest percentages of companies reporting revenues above estimates to date.
Companies are also beating revenue estimates by wider margins than average for the second quarter. In aggregate, companies are reporting actual sales that are 1.2% above expectations. This percentage is well above the trailing one-year average (+0.5%) and the trailing five-year average (+0.5%).
At the sector level, the Energy (+4.2%) and Financials (+2.3%) sectors are reporting the largest upside aggregate differences between actual sales and estimated sales.
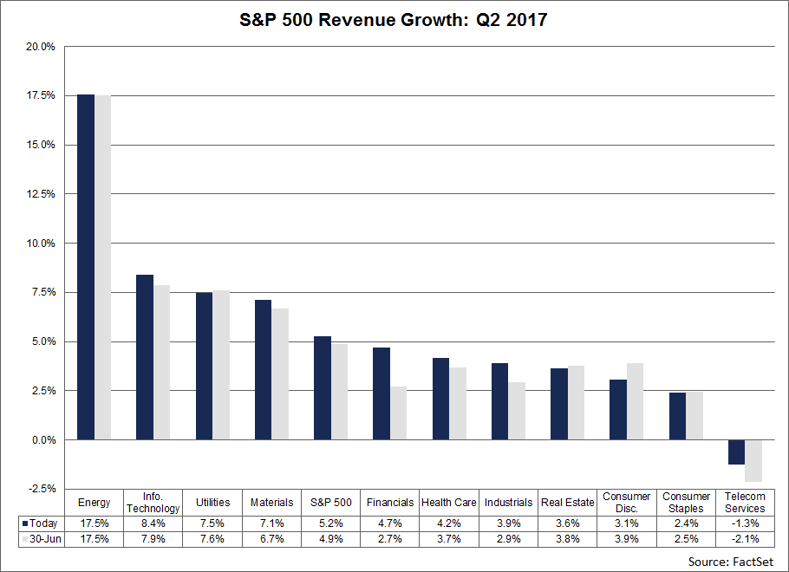
Because of the number and magnitude of these upside surprises, the blended revenue growth rate for the quarter has increased to 5.2% today from 4.9% on June 30. The chart on the following page provides a breakdown of the revenue growth rates as of today and as of June 30 by sector.

Insight/Author%20Bios/JohnButters2.jpg)
Mr. John Butters is Vice President and Senior Earnings Analyst at FactSet. His weekly research report, “Earnings Insight,” provides analysis and commentary on trends in corporate earnings data for the S&P 500 including revisions to estimates, year-over-year growth, performance relative to expectations, and valuations. He is a widely used source for the media and has appeared on CNBC, Fox Business News, and the Business News Network. In addition, he has been cited by numerous print and online publications such as The Wall Street Journal, The Financial Times, The New York Times, MarketWatch, and Yahoo! Finance. Mr. Butters has over 15 years of experience in the financial services industry. Prior to FactSet in January 2011, he worked for more than 10 years at Thomson Reuters (Thomson Financial), most recently as Director of U.S. Earnings Research (2007-2010).

More Than 65% of S&P 500 Earnings Calls for Q4 Cited “AI”
Stay updated on the S&P 500 with this earnings insight from FactSet, featuring analysis of AI mentions at the aggregate and...
Number of S&P 500 Earnings Calls Citing “Tariffs” Declined for 3rd Straight Quarter
Stay updated on the S&P 500 with FactSet. This report summarizes tariff mentions during earnings calls the past three months at...
Earnings Insight Infographic: Q4 2025 By the Numbers
Get a quick look back at S&P 500 aggregate performance with these key highlights of the fourth quarter 2025 earnings season from...
Analysts Lowering Quarterly EPS Estimates for First Time Since Q2 2025
In this FactSet earnings report, read our quantitative analysis of current EPS against historical averages for the S&P 500,...
The information contained in this article is not investment advice. FactSet does not endorse or recommend any investments and assumes no liability for any consequence relating directly or indirectly to any action or inaction taken based on the information contained in this article.
